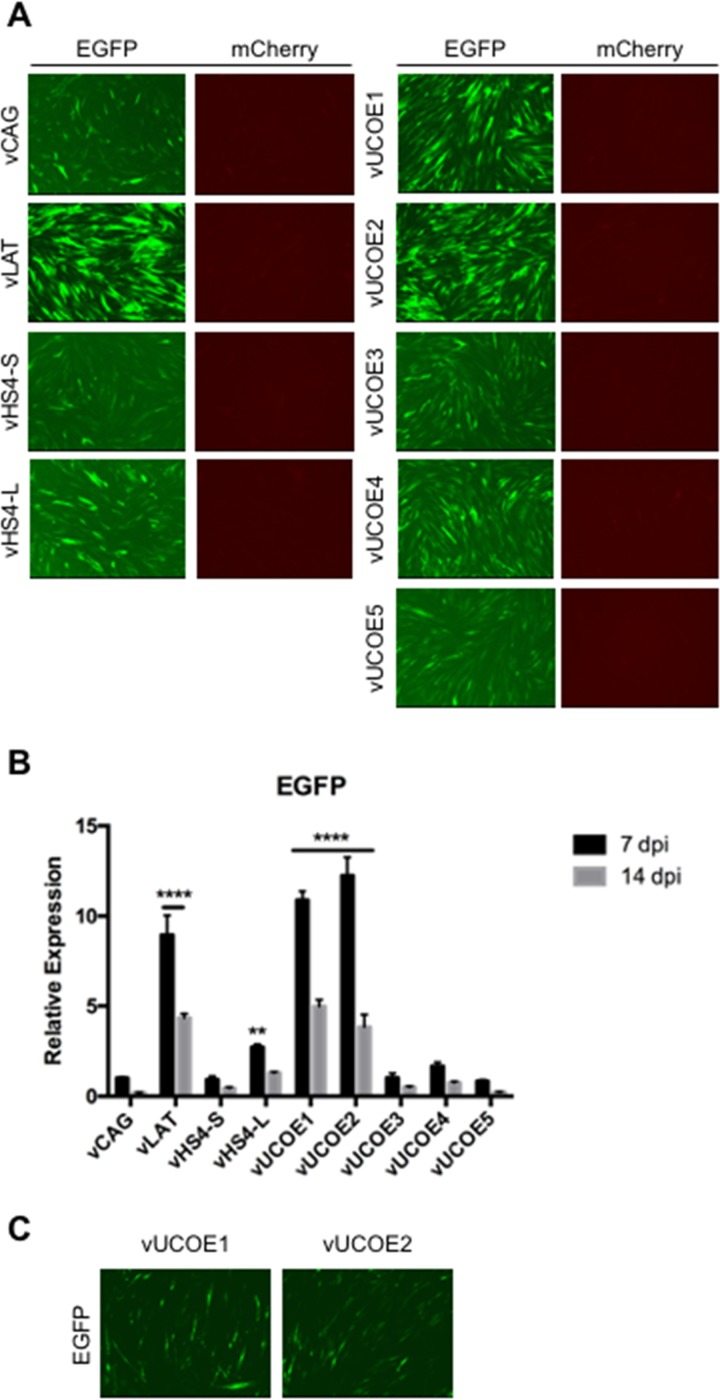
FIG 2.
Transgene expression in infected HDFs at 7, 14, and 28 dpi. The cells were infected with the indicated viruses at 25,000 gc per cell. (A) EGFP and mCherry fluorescence in infected HDFs at 7 dpi. All the images of each marker were collected at a fixed exposure time and automatically adjusted for optimal contrast and brightness (autoscale setting; Meta Imaging Series 7.7 MetaMorph software; Molecular Devices). (B) Relative EGFP mRNA levels in infected HDFs as determined by qRT-PCR analysis. Expression levels were normalized to gc in the same samples and are presented as means and SD relative to the level in vCAG-infected cells at 7 dpi (see “Statistics” in Materials and Methods for details). ****, P ≤ 0.0001; **, P ≤ 0.01 compared to vCAG at the same time point (2-way ANOVA). (C) EGFP fluorescence in vUCOE1- and vUCOE2-infected HDFs at 28 dpi.

