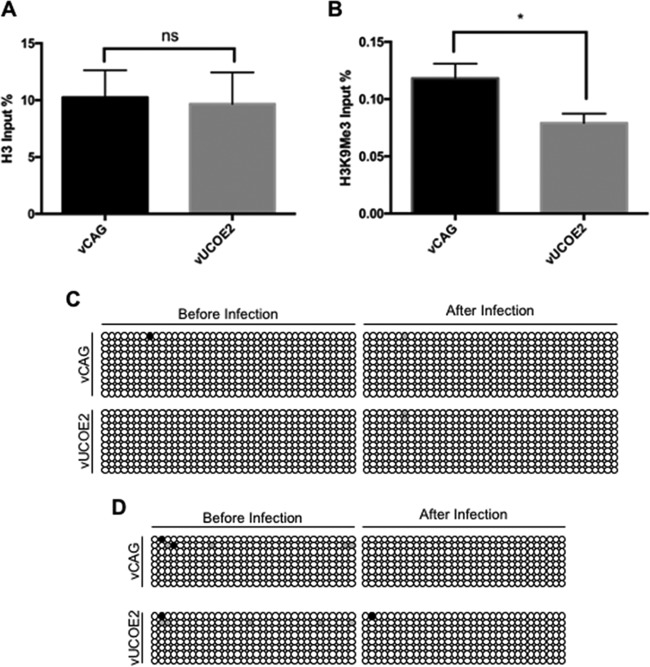
FIG 5.
(A and B) Total H3 (A) and transcriptionally repressive H3K9Me3 (B) associated with the CAG promoters of vCAG and vUCOE2 7 days after infection of HDFs. qPCR was performed to determine the amount of CAG DNA precipitated by each antibody. The graphs show the percentages of CAG DNA precipitated with anti-histone H3 or K9Me3-specific anti-H3 as a percentage of total CAG DNA prior to precipitation. The error bars represent SD in the results of 4 experiments. ns, not significant; *, P < 0.05; Mann-Whitney test. (C and D) DNA methylation status of two different segments of the CAG promoter in vCAG and vUCOE2 before infection and at 7 days post-HDF infection. Each row of circles represents an individual cloned PCR product from the chicken β-actin component of the CAG promoter after bisulfite conversion. Each circle represents a CpG site. The white circles represent unmethylated CpG sites, and the black circles represent methylated CpG sites; the gray circles represent sites that could not be determined. (C) Primer set M2. (D) Primer set M4.

