FIG 3.
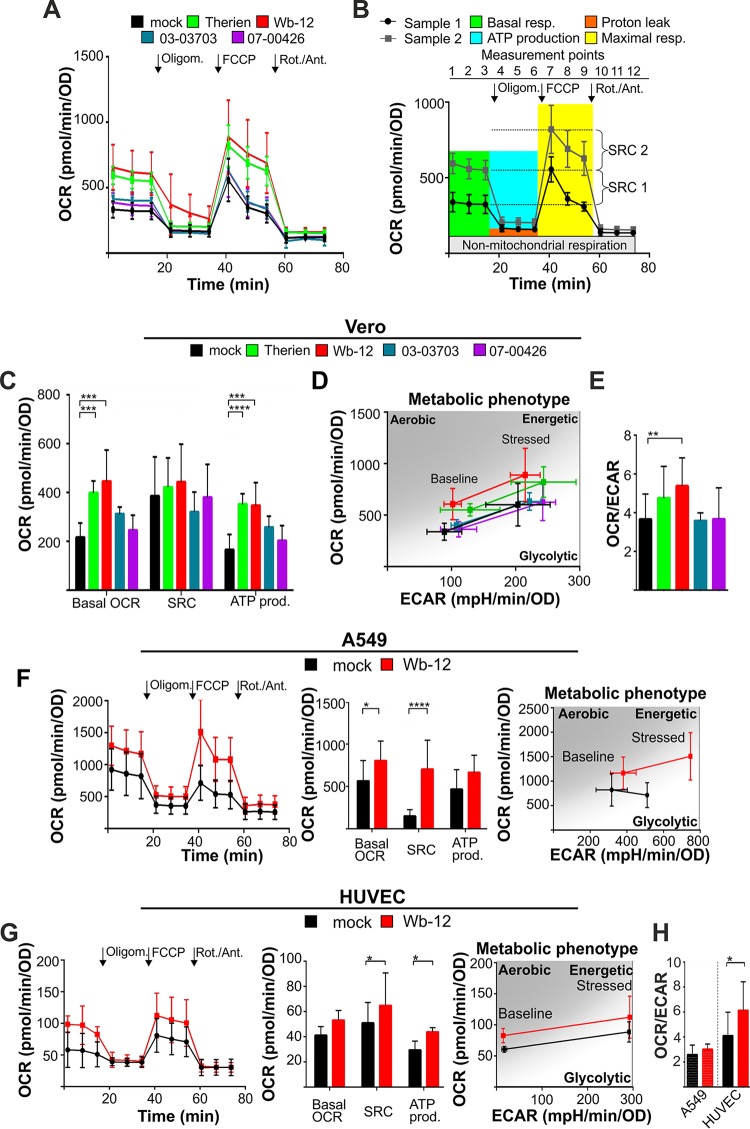
Oxygen consumption rate and metabolic phenotype of RV-infected epithelial cells (Vero and A549) and HUVECs. (A) The OCR was measured at 72 hpi in mock- and RV-infected Vero cells under basal and stressed conditions using Seahorse technology with a Mito stress test kit. Sequential injection of oligomycin (Oligom.), FCCP, and rotenone/antimycin A (Rot./Ant.) is indicated. (B) Calculation of mitochondrial activity was done as illustrated. Maximal respiration is the OCR after the injection of FCCP minus the OCR after injection of oligomycin. Proton leak is the OCR after the injection of rotenone/antimycin A minus OCR after injection of oligomycin. ATP production (based on respiration) is the difference between the basal respiration and the respiration after the injection of oligomycin. The spare respiratory capacity (SRC) is the OCR after the injection of FCCP minus the OCR at basal respiration (measurement point 3). (C) The data obtained in panel A were used to calculate the SRC and ATP production (ATP prod.), as described in panel B. (D) Metabolic phenotype indicative of the bioenergetic state of mock- and RV-infected Vero cells (72 hpi) generated through OCR and extracellular acidification rate (ECAR) values under basal (normal) conditions and stressed conditions (application of oxidative phosphorylation [OXPHOS] inhibitors of the Mito stress test kit). (E) The ratio of the OCR to the ECAR was calculated based on the values obtained for baseline (normal) conditions in mock- and RV-infected Vero cells (72 hpi). An increase in the OCR/ECAR ratio compared to the mock-infected cells is indicative of a higher OXPHOS activity. (F and G) For mock- and RV-infected A549 (at 72 hpi) cells (F) and HUVECs (at 36 hpi) (G), the OCR was measured under basal and stressed conditions using a Mito stress test kit. Sequential injection of the indicated inhibitors was used to calculate the SRC and ATP production, as described in panel B, and to generate the metabolic phenotype. (H) OCR/ECAR ratio based on OCR and ECAR values obtained for baseline (normal) conditions in mock- and RV-infected A549 cells (72 hpi) and HUVECs (36 hpi). An increase in the OCR/ECAR ratio compared to mock-infected cells indicates a higher OXPHOS activity.

