
Fig. 2.
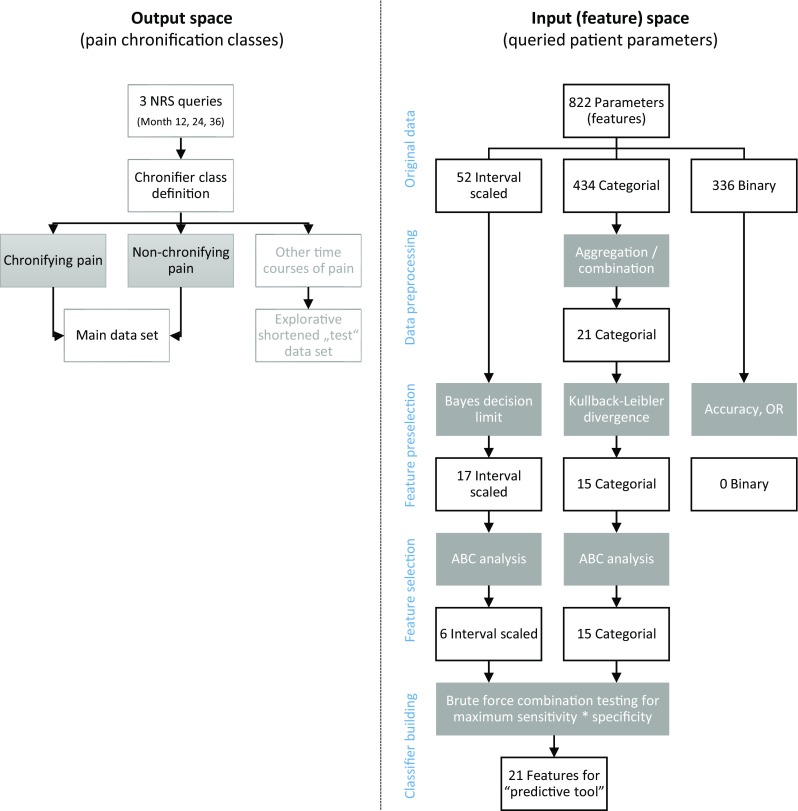
Flow chart of the data analysis. The figure provides an overview on the applied machine-learning approach in four steps (indicated in blue: output space preparation, input space feature pre-selection, feature selection and classifier building, including validation). The white frames show the variable flow; the gray frames depict the bioinformatics operation applied on the variables. During feature pre-selection and feature selection, the number of candidate variables qualifying as component s of a diagnostic tool respectively classifier was stepwise reduced (initially 542, finally 21), forwarding to the next analytical step only those features that had passed the criteria of the actual selection procedure. The Bayesian decision limit and Kullback–Leibler divergence refer to the respective standard procedure presented elsewhere [28, 35]