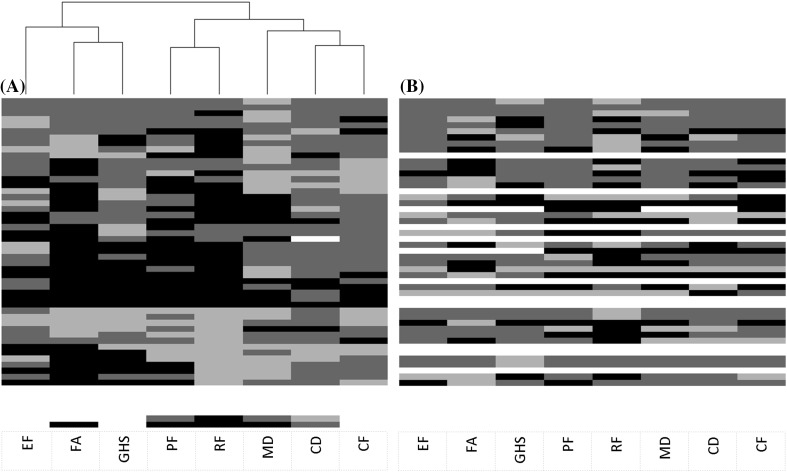
Fig. 3.
Cluster analysis of differences in health-related-quality of life scores between a baseline-3 months and b 3–6 months. Black indicates deterioration; dark grey a stable score; light grey improvement; and white a missing value. On the vertical axis all 55 patients included in this study are displayed. a Patients are also clustered, but dendrogram is not shown. b Patients and HRQoL scales are similarly ordered for comparison. EF emotional functioning; FA fatigue; GHS global health status; PF physical functioning; RF role functioning; MD motor dysfunction; CD communication deficits; CF cognitive functioning

