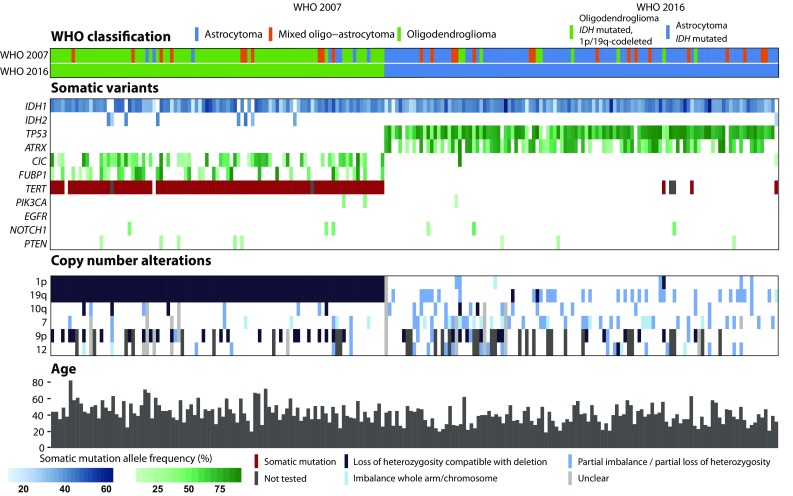
Fig. 1.

Oncoprint plot with overview of somatic alterations per patient. At the top of the figure the WHO 2007 and WHO 2016 classification are shown. In the middle part all somatic variants and copy number alterations are shown. Patients are separated based on the WHO 2016 classification. IDH mutated 1p/19q-codeleted patients are depicted in the left part of the figure and IDH mutated astrocytoma patients on the right part of the figure. The bottom part of the figure shows the clinical characteristic age per patient
