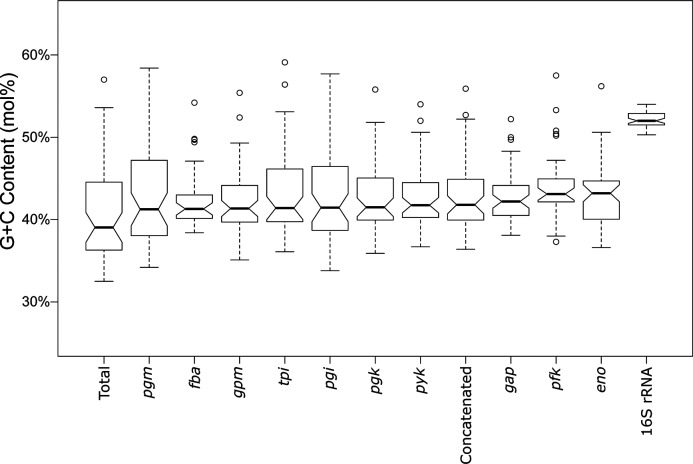
Fig. 6.
G+C mol% analysis of Lactobacillus glycolysis genes. Depicted are notched boxplots of G+C mol% for each glycolysis gene, concatenated genes, 16S rRNA and total genome. Genes are placed in order of increasing median. If two notches do not overlap, it is an indication of strong evidence for differing medians.

