Fig. 4.
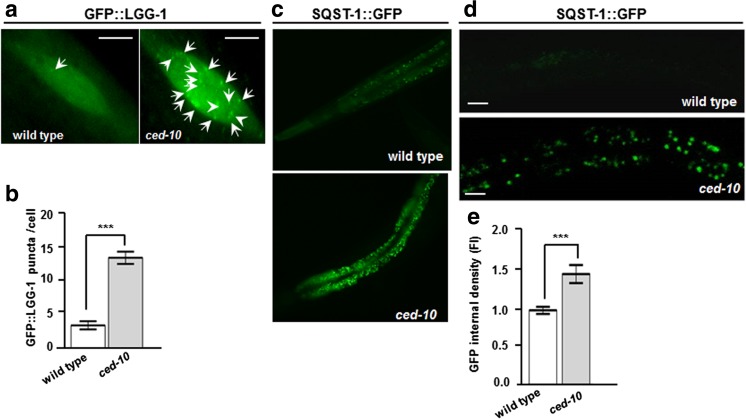
Autophagic markers accumulate in ced-10 mutant worms. a L4 worms expressing the reporter GFP::LGG-1 (adIs2122 [Plgg-1::GFP::lgg-1; rol-6(su1006)] in hypodermal seam cells, without (left panel, wild type) and with (right panel) the ced-10(n3246) mutation. GFP::LGG-1 puncta are labeled with an filled arrow. Magnification bar is 5 μm. b The bar graph indicates the number of GFP::LGG-1 foci per cell at the indicated genotypes. These results are mean ± SEM of three independent experiments performed in triplicate. Statistics is Student’s t test. ***P ≤ 0.001. c, d Worms expressing the autophagy reporter SQST-1::GFP (bpIs151[Psqst-1::sqst-1::GFP]) were crossed with ced-10(3246) animals and the GFP fluorescence intensity (FI) was analyzed under a fluorescence (c) or a confocal (d) microscope. d (upper panel) L4 animals expressing the array SQST-1::GFP without induction of the GFP reporter in normal conditions. d (bottom panel) The ced-10(n3246) mutation increased GFP intensity and aggregation. Magnification bar is 20 μm. e Normalized fluorescence intensity (FI) observed in SQST-1::GFP animals without and with the ced-10(n3246) mutation. Thirty animals were analyzed per genotype. Data are represented as the mean ± SEM and were obtained by comparing wild type animals (without the ced-10(n3246) mutation) with ced-10 mutated animals. Statistics, ***P < 0.001, Student’s t test

