Fig. 5.
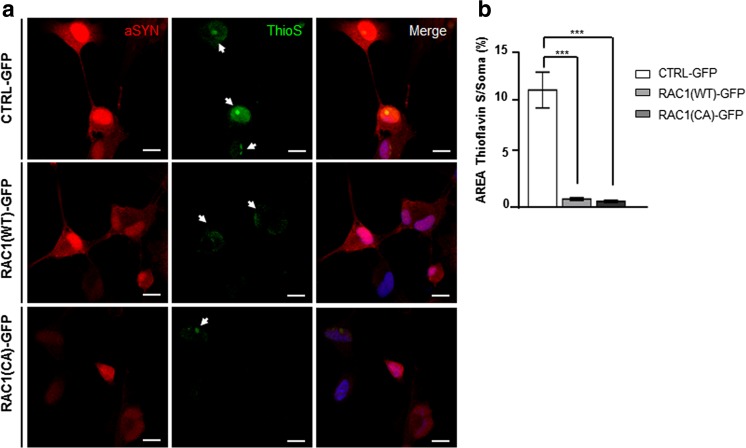
Rac1 activity decreases α-SYN accumulation and aggregation in the neuroblastoma cell line BE(2)-M17. a Representative confocal images of α-SYN over-expressing cells induced with 10 μM retinoic acid (RA) and treated with 10 mM sodium butyrate (SB) for 36 h. Cells were transduced with Control-GFP (upper row), RAC1 (WT)-GFP (middle row) and RAC1 (CA)-GFP (bottom row), and co-stained for Thioflavin S (green) and α-SYN (red). Arrows indicate Thioflavin S positive aggregates with amyloidal structure. b Bar graph showing the quantitative analyses of the neuronal soma area (in percentage %) covered by Thioflavin S positive stain in individual cells transduced with (WT)- or (CA) RAC1 or with the corresponding control. N = 14 (EV), N = 25 (WT), and N = 24 (CA), from at least three independent experiments. Data are presented as mean ± SEM. Statistics, ***P < 0.001, one-way ANOVA with Bartlett’s test correction followed by post hoc Tukey test. Scale bars represent 10 μm

