Fig. 7.
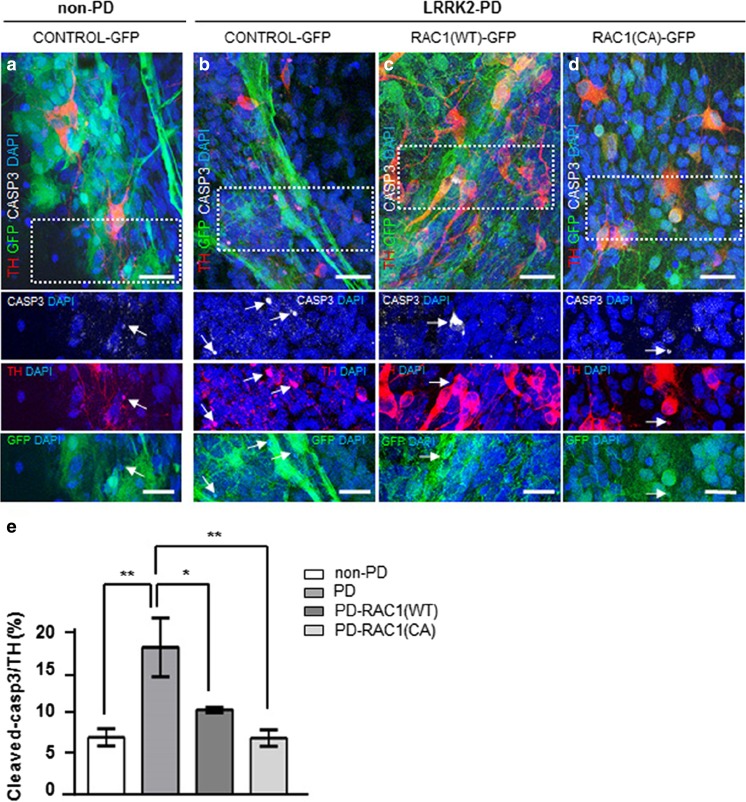
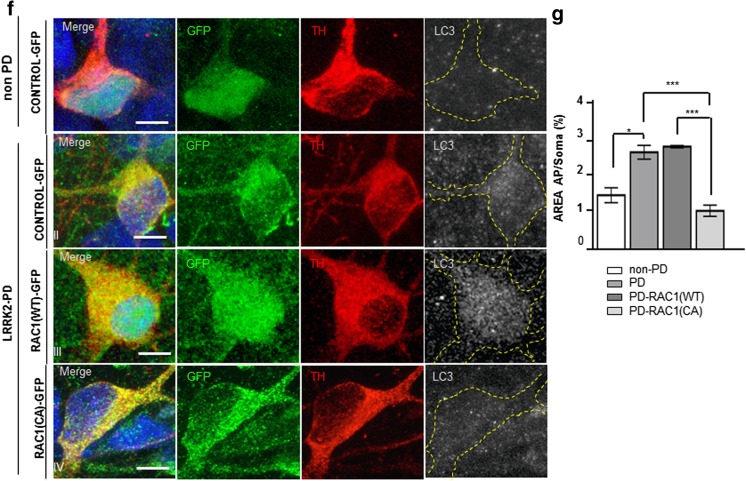
RAC1 activity increases the long-term survival of PD-derived DAn and alleviates autophagy impairment. (A–D) Confocal images of non- PD (A) and PD-iPSC-derived DA cultures transduced with Control-GFP (B), RAC1 (WT)-GFP (C), and RAC1 (CA)-GFP (D), stained for GFP (green), TH (red) and cleaved Caspase-3 (white). A representative area was highlighted in dashed lines and expanded in below panels. The corresponding lower insets show higher magnification images of each separate channel, cleaved caspase-3, TH and RAC1-GFP respectively. TH+ neurons, stained with Caspase-3 and transduced with RAC1-GFP constructs are labeled with white arrow tips. Caspase-3 posoNuclei are counterstained with DAPI, shown in blue. PD-derived cells transduced with Control-GFP (second panel) showed increased numbers of triple positive TH/GFP/Caspase 3 staining in TH+ neurons in comparison to the other conditions tested, where cells were non-PD (first panel left) or transduced with RAC1 (WT)-GFP and RAC1 (CA)-GFP (third and fourth panels respectively). Extension bar from A–D is 20 and 10 μm for top and bottom panels respectively. e Bar graph showing the quantification of the number of TH/GFP double-positive neurons presenting cleaved Caspase-3 staining. Data is the average of at least two-independent experiments and are presented as mean ± SEM. Statistics, *P < 0.05, **P < 0.01, and ***P < 0.001, Two-way ANOVA, Tukey post hoc test. f Confocal images of non-PD (left panel) and PD-iPSC-derived DA cultures transduced with Control-GFP (second row), RAC1 (WT)-GFP (third row), and RAC1 (CA)-GFP (fourth row), stained for GFP (green), TH (red) and LC3 (gray). Non-PD cells (first row) and PD cells transduced with RAC1 (CA)-GFP (fourth row) showed similar amount of LC3-II positive vesicles in TH+/GFP+ neurons. Nuclei are counterstained with DAPI, shown in blue. Extension bar is 5 μm. g Bar graph showing the quantification of the neuronal soma area (in percentage %) covered by LC3-II positive vesicles in at least 15 DA neurons. Data is the average of at least two-independent experiments and are presented as mean ± SEM. Statistics, *P < 0.05, Two-way ANOVA, post hoc Tukey test


