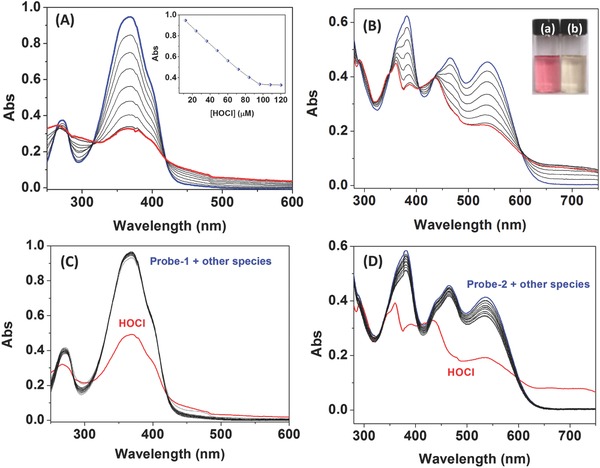
Figure 1.

A) UV–vis absorption spectra of Probe‐1 (10 × 10−6 m) in PBS buffer (DMSO:H2O = 3:7, v/v; pH 7.4) in the presence of different concentrations of HOCl (0–120 × 10−6 m), inset: plot of the absorbance at 367 nm of Probe‐1 against the concentration of HOCl. B) UV–vis absorption spectra of Probe‐2 (10 × 10−6 m) in PBS buffer (DMSO:H2O = 3:7, v/v; pH 7.4) upon the addition of different concentrations of HOCl (0–100 × 10−6 m), inset: the color change of Probe‐2 in the presence of HOCl. C) UV–vis absorption spectra of Probe‐1 (10 × 10−6 m) in PBS buffer (DMSO:H2O = 3:7, v/v; pH 7.4) in the presence of various ROS and anion species (120 × 10−6 m). D) UV–vis absorption spectra of Probe‐2 (10 × 10−6 m) in PBS buffer (DMSO:H2O = 3:7, v/v; pH 7.4) in the presence of various ROS and anion species (100 × 10−6 m).
