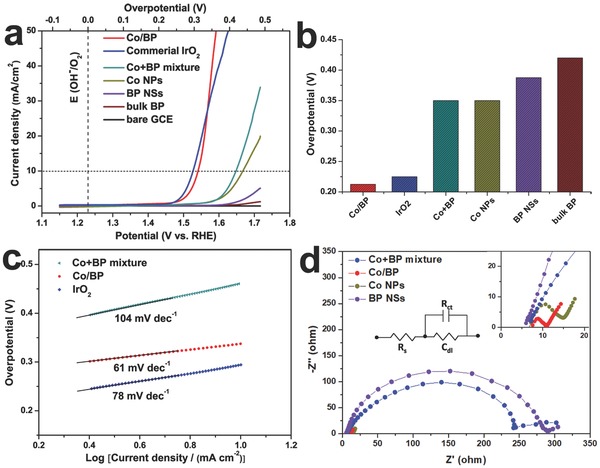
Figure 4.

a) LSV curves and b) onset overpotential of Co/BP nanohybrids, commercial IrO2, the physical mixture of Co+BP, Co NPs, BP NSs, the bulk BP, and bare GCE. c) Tafel plots of Co/BP nanohybrids, commercial IrO2 and the physical mixture of Co+BP. d) Nyquist plots of the physical mixture of Co+BP, Co/BP nanohybrids, Co NPs and BP NSs, with inset showing the electrical equivalent circuit used to simulate the Nyquist plots .The upper right inset is the magnification of the Nyquist plots.
