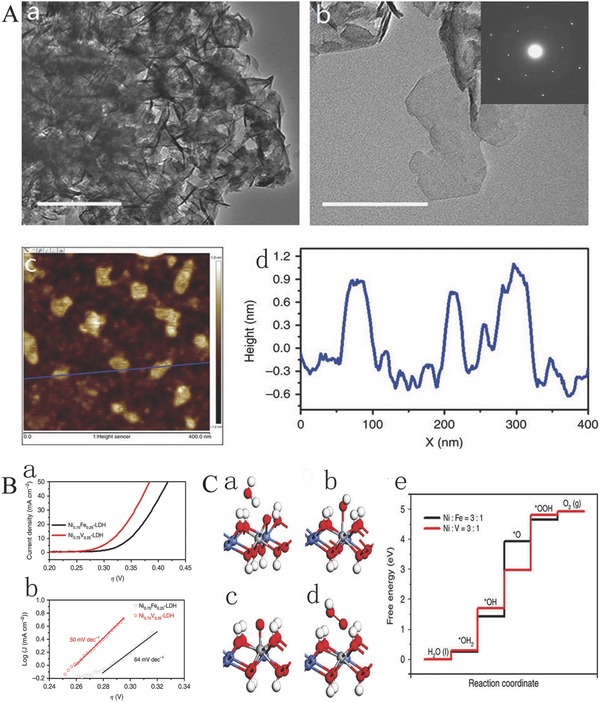
Figure 1.

A) TEM and AFM. a,b) TEM images of Ni0.75V0.25‐LDH (inset of (b): selected area electron diffraction pattern); c) AFM image and d) height profile of Ni0.75V0.25‐LDH nanosheets. B) LSV curves and Tafel plots. a) LSV curves and b) Tafel plots of Ni0.75Fe0.25‐LDH and Ni0.75V0.25‐LDH. C) Adsorption geometries of the intermediates H2O, *OH, *O, and *OOH in (a)–(d), respectively. The red, blue, white, and gray atoms represent the O, Ni, H, and V atoms, respectively. The adsorption structures are similar to these when one Ni is substituted by Fe instead of V; e) the free‐energy landscape. Reproduced with permission.63 Copyright 2016, Nature Publishing Group.
