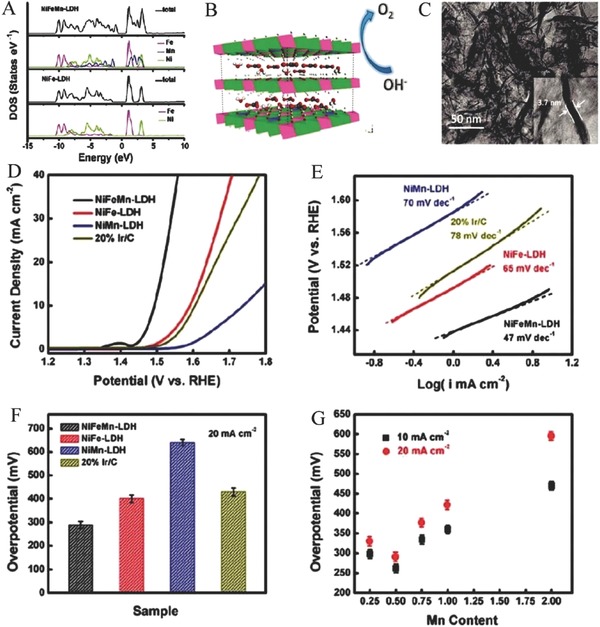
Figure 3.

A) Total DOS and partial DOS () curves of NiFeMn‐LDH and NiFe‐LDH. B) Structural image of NiFeMn‐LDH; C) TEM image of NiFeMn‐LDH; D) LSV curves of NiFeMn‐LDH, NiFe‐LDH, NiMn‐LDH, and the commercial Ir/C catalyst; E) the corresponding Tafel plots; F) the corresponding overpotential at a current density of 20 mA cm−2; G) the required overpotential of the different Mn content in the ternary LDHs at 10 and 20 mA cm−2, respectively. Reproduced with permission.131 Copyright 2016, The Royal Society of Chemistry.
