
Figure 6.
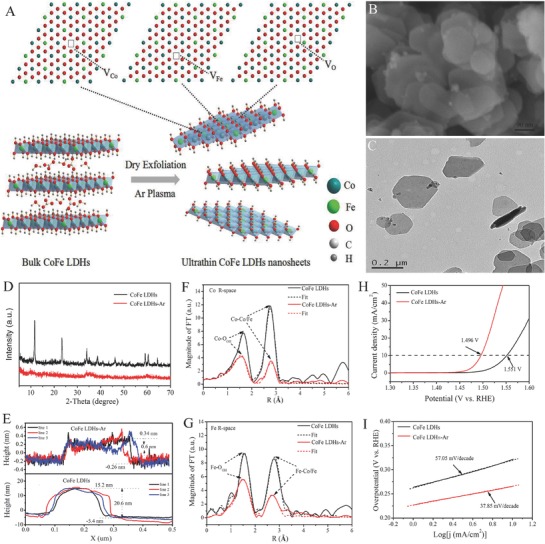
A) Illustration of Ar plasma exfoliated CoFe LDH nanosheets; B) SEM and C) TEM image of the ultrathin CoFe LDHs‐Ar nanosheets; D) XRD patterns of the bulk CoFe LDH nanosheets and ultrathin CoFe LDHs‐Ar nanosheets; E) the corresponding height curves; F) magnitude of k 3‐weighted Fourier transforms of the Co edge XANES spectra for bulk‐CoFe LDHs and ultrathin CoFe LDHs‐Ar with the corresponding curve‐fitting results; G) magnitude of k 3‐weighted Fourier transforms of the Fe edge XANES spectra for bulk CoFe LDHs and ultrathin CoFe LDHs‐Ar with the corresponding curve‐fitting results; H) the OER performance of bulk CoFe LDHs and the ultrathin CoFe LDH‐Ar nanosheets; I) the corresponding Tafel plots. Reproduced with permission.73 Copyright 2017, Wiley‐VCH.