Figure 12.

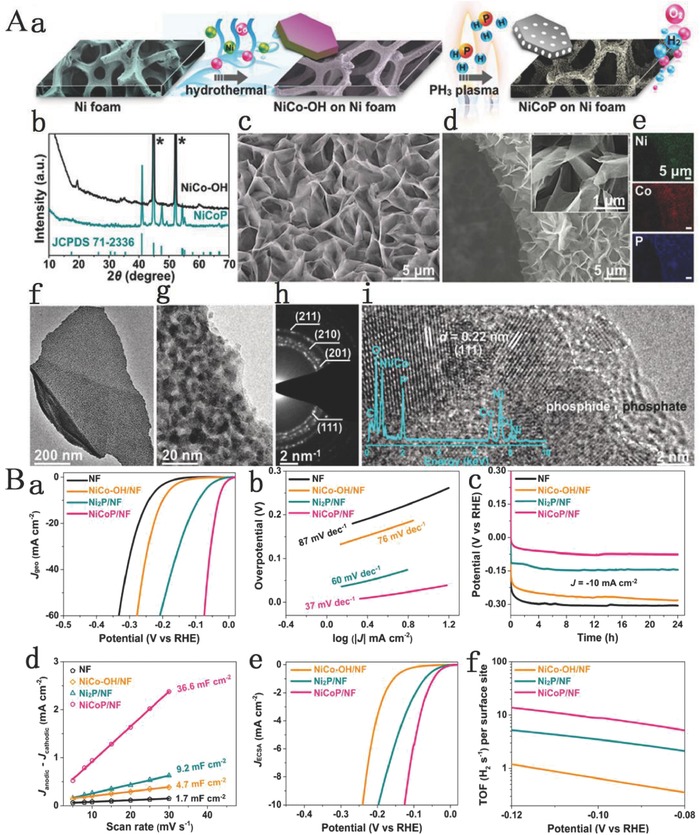
A) Synthetic route and structural characterization of the NiCoP nanostructure. a) Schematic illustration of the synthetic route for NiCoP nanostructure on Ni foam. b) XRD patterns of NiCo‐OH and the converted NiCoP. The asterisks mark the diffraction peaks from Ni foam. c) SEM image of NiCo‐OH. d) SEM images and e) the corresponding EDS elemental maps of the NiCoP. f,g) TEM images, h) SAED pattern, and i) high‐resolution TEM image and EDS spectrum (inset) of the NiCoP. The dashed white line highlights the crystalline–amorphous boundary. B) HER electrocatalysis in 1 m KOH. a) IR‐corrected polarization curves per geometric area of the NiCoP/NF recorded at a scan rate of 3 mV s−1, along with Ni2P/NF, NiCo−OH/NF, and NF for comparison. b) Polarization curve–derived Tafel slopes for the corresponding electrocatalysts. C) OER electrocatalysis in 1 m KOH. a) IR‐corrected polarization curves per geometric area of the NiCo‐P/NF recorded at a low scan rate of 0.5 mV s−1, along with Ni−P/NF, NiCo−OH/NF, and NF for comparison. b) Polarization curve–derived Tafel slopes for the corresponding electrocatalysts. D) NiCoP/NF electrocatalyst for overall water splitting in 1 m KOH. a) Schematic illustration of two‐electrode cell using NiCoP/ NF for both anode and cathode for water splitting. b) Polarization curve recorded at 0.5 mV s−1. Inset: Digital photograph of the two electrode configuration. c) Long‐term stability test carried out at constant current densities of 10, 20, and 50 mA cm−2. Reproduced with permission.94 Copyright 2016, American Chemistry Society.
