Figure 13.

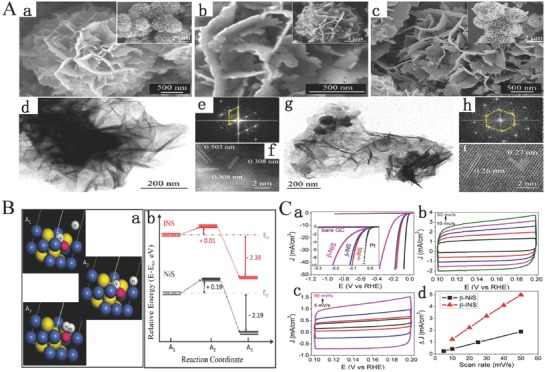
A) SEM images of a) FeNi LDH precursor, b) β‐INS nanosheets, and c) metallic α‐INS nanosheets. TEM images d,g), HRTEM images f,i) and the corresponding Fourier transformed patterns e, h) of the β‐INS d–f) and the α‐INS g–i) nanosheets. B) Schematic reaction pathway of HER on α‐INS ultrathin nanosheets in acid environment a). b) Kinetic energy barrier profiles of HER on α‐INS and α‐NiS nanosheets. The yellow, blue, and red spheres in A1−A3 represent S, Ni, and Fe atoms, respectively. C) ECSA tests of catalysts toward HER in the acidic electrolytes of 0.5 m H2SO4. a) LSV curves of β‐NiS‐, β‐INS‐, and α‐INS‐catalyzed HER, and b) CV curves of β‐INS and c) β‐NiS nanosheets with various scan rates. d) Charging current density differences plotted against scan rates. The linear slope, equivalent to twice the double‐layer capacitance, C dl, was used to represent the ECSA. Reproduced with permission.95 Copyright 2015, American Chemistry Society.
