Fig. 6.
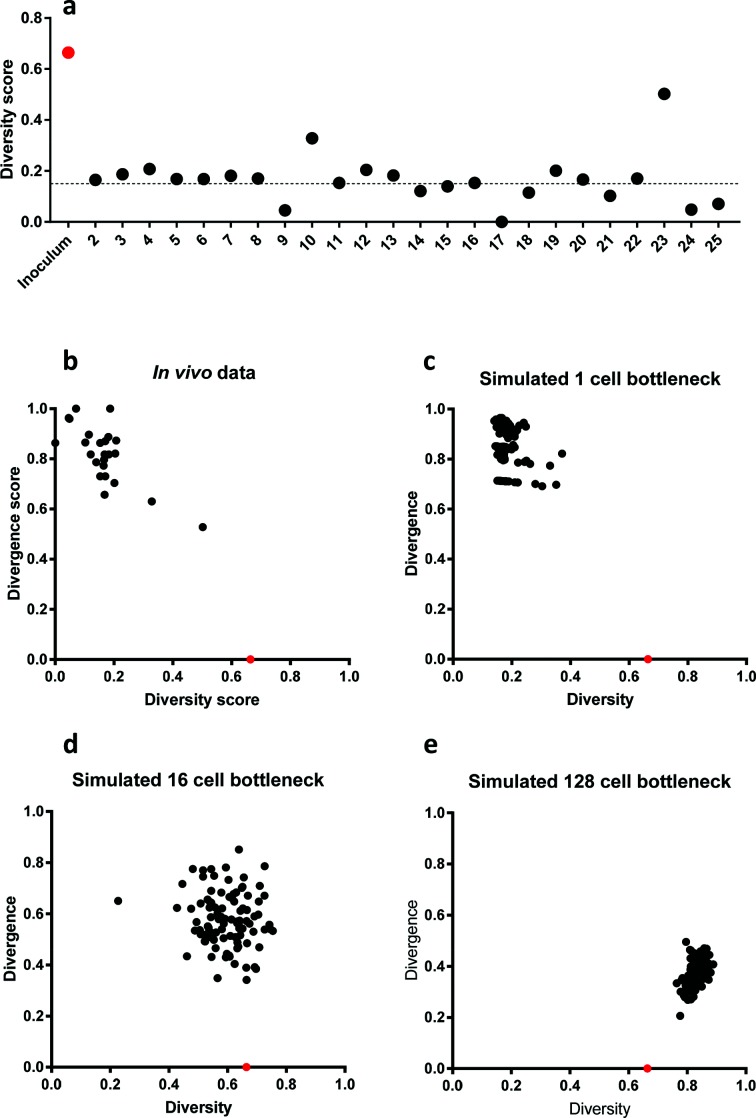
Diversity and divergence scores for the variable 5-gene phasotypes in input and in vivo output populations. Diversity scores were calculated using the numbers of colonies with each phasotype for the phasotype composed of the five most variable genes (see Fig. 4). A score of 1 is the highest possible value for diversity, whereby all phasotypes are present in equal proportions while 0 is the lowest diversity score, whereby a single phasotype is present in all analysed colonies. Divergence from the input population was determined using a population separation equation. A divergence score of 1 indicates that there are no phasotypes in common with the inoculated population, whereas a divergence score of 0 indicates that the phasotype composition of the sample is identical to the inoculum. Panel a, diversity scores for all input and output populations from the in vivo experiment with 24 birds. The dotted line is the mean diversity score for all chickens. Panel b, a plot of diversity versus divergence for all output population. Panels (c–e), in silico simulations were performed using a previously published model to determine the effects of bottleneck size on phasotype prevalence in C. jejuni populations [11]. The input for the model was the phasotype distribution obtained from the inoculum of the in vivo dataset. The model was run for a single bottleneck with sizes of 1 (c), 16 (d) and 128 (e) cells. The diversity of the input (inoculum) population is shown by a red point on each graph. Numbers on the x-axis of panel (a) refer to specific chickens.

