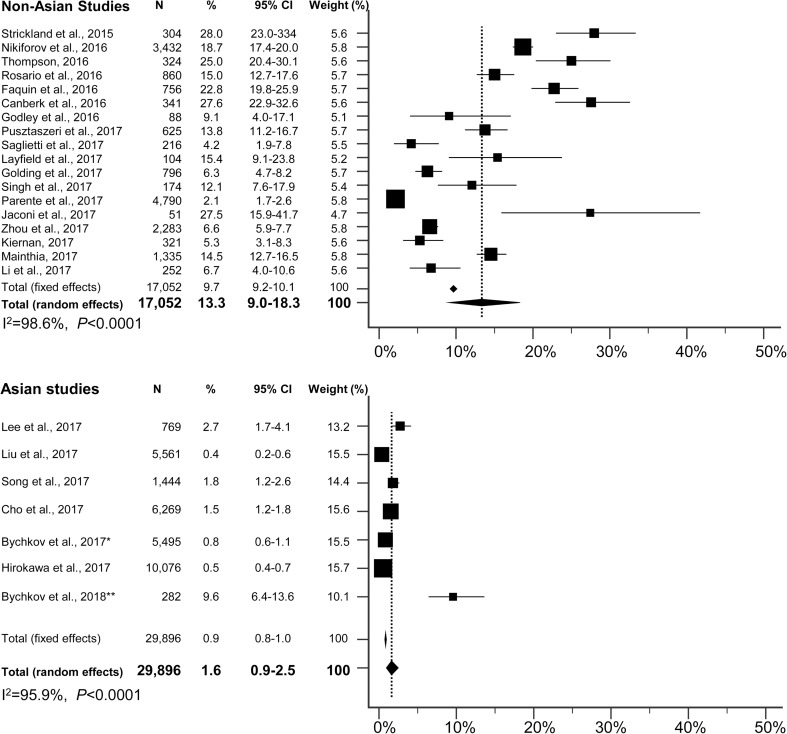
Fig. 1.
Forest plot of the NIFTP rate among PTC or thyroid malignancies in non-Asian and Asian series. The boxes indicate the point estimates for each study. The size of the box represents the weight given to each series. The whiskers indicate the 95% CI. Diamonds indicate the estimated average. The length of the diamond is the 95% CI for the combined average. *To avoid duplication, three institutions were excluded from the series of Bychkov et al. [26], because their cohorts were further expanded and reported in the original single-institution studies (Cho et al. [19], Liu et al. [24], and Hirokawa et al. [21]). **To avoid overlap, only data from India and Thailand are represented, because other cohorts were partially reported by Bychkov et al. [26]

