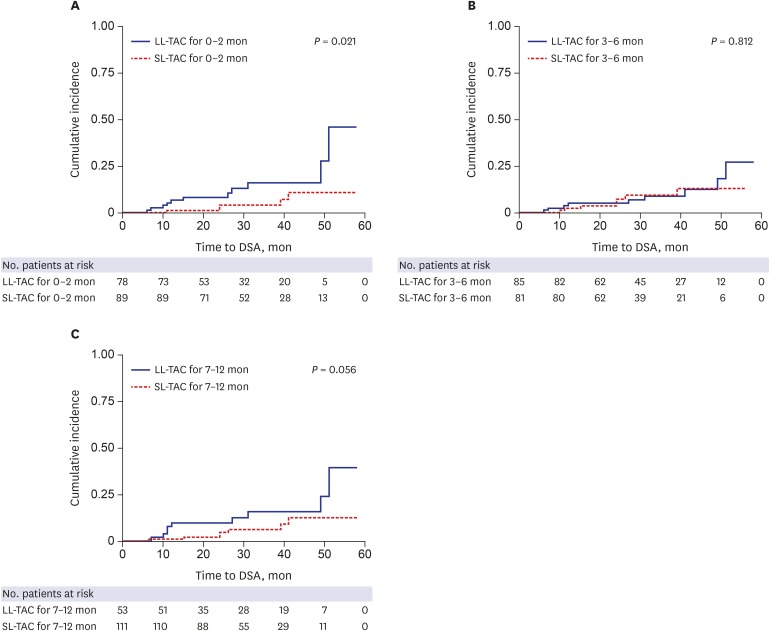
Fig. 2. Kaplan-Meier analysis for DSA development according to TAC trough levels after KT. (A) TAC trough levels at 0–2 months and DSA development after 1 day post-transplant, (B) TAC trough levels at 3–6 months and DSA development after 6 months post-transplant, (C) TAC trough levels at 7–12 months and DSA development after 12 months post-transplant. LL-TAC group for 0–2 months after KT showed significantly increased risk for the development of DSA compared to SL-TAC group (P = 0.021).
DSA = donor-specific anti-human leukocyte antigens antibodies, TAC = tacrolimus, KT = kidney transplantation, LL = low-level, SL = standard-level.

