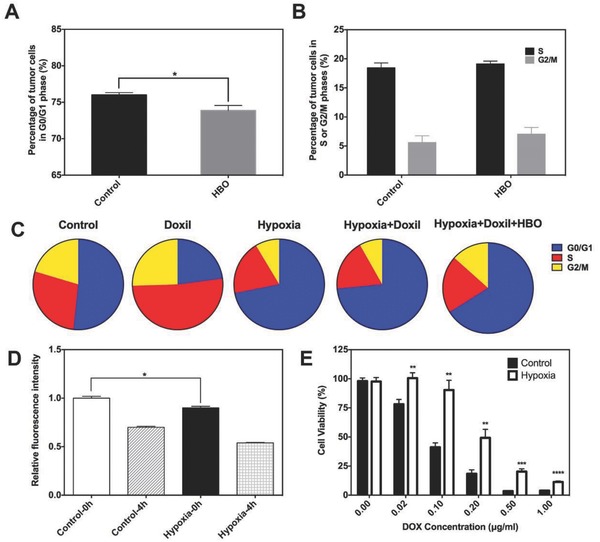
Figure 4.

HBO sensitizing cancer cells to DOX. A,B) In vivo cell cycle analysis. C) In vitro cell cycle analysis. D) Cell uptake and efflux study. The relative fluorescence intensity of DOX after H22 cells was treated with 5 µg mL−1 DOX in serum‐free medium for 2 h. Cells were then washed with phosphate buffer saline (PBS) three times and then the relative fluorescence intensity of DOX within cells was determined by flow cytometry (shown as Control‐0 h and Hypoxia‐0 h). H22 cells were then reincubated for another 4 h and washed again. The relative fluorescence intensity of DOX inside cells was again determined by flow cytometry (shown as Control‐4 h and Hypoxia‐4 h). E) The cell viability of H22 cells treated with different concentrations of DOX at 48 h by CCK‐8 assay. Cells were preincubated under hypoxia (1% O2) for 24 h in hypoxia group. Data as mean ± S.E. (n = 3). *P < 0.05, **P < 0.005, ***P < 0.001, ****P < 0.0001.
