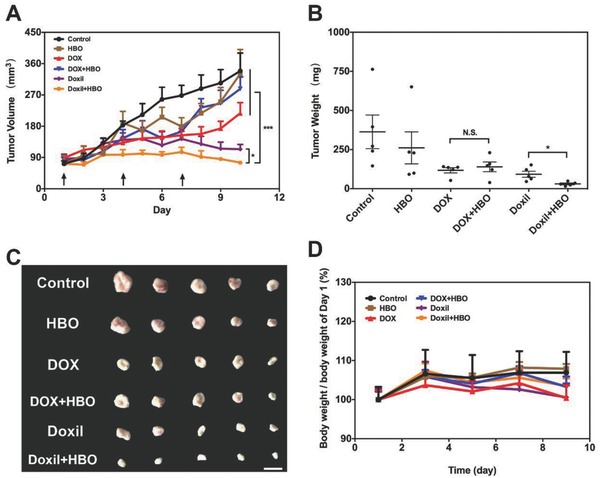
Figure 5.

In vivo antitumor effects. A) Tumor growth inhibition profiles in H22‐bearing mice after intravenous injection of free DOX and DOX‐loaded liposome at DOX dosage of 4 mg kg−1 with and without HBO therapy. For control and HBO, saline was used. B) Tumor weight at the end of tumor growth inhibition studies. C) Representative photos of H22 tumor tissue at the end of tumor growth inhibition studies. The scale bar is 10 mm. D) Body weight change profiles during the tumor growth inhibition studies. Data as mean ± S.E. (n = 5). *P < 0.05, ***P < 0.001. N.S. as not significant.
