Figure 6.

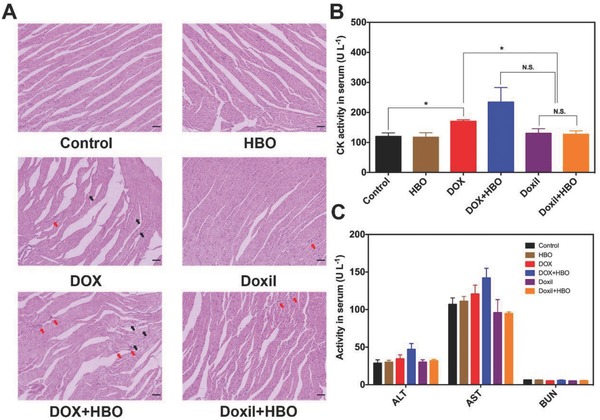
Side effect analysis. A) H&E analysis of heart tissue at the end of tumor growth inhibition studies. Red arrow represents neutrophil accumulation and black arrow represents myocardial necrosis. The scale bar is 50 µm. B) CK activity and C) ALT, AST, and BUN activities in serum at 8 h after a single dose of free DOX and DOX‐loaded liposome at DOX dosage of 15 mg kg−1 with and without HBO therapy. Data as mean ± S.E. (n = 5). *P < 0.05, N.S. as not significant.
