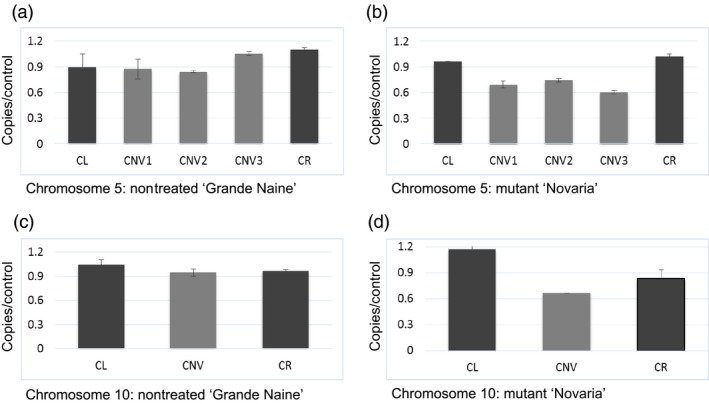
Figure 2.

Quantitative real‐time PCR evaluation of DNA copy number. Panels (a) and (b) show data for chromosome 5 from nontreated ‘Grande Naine’ and mutant ‘Novaria’, respectively. CL and CR represent data from primers covering left and right boundaries outside of the predicted copy number variation region. Bars marked with CNV represent different regions internal to the predicted copy number variation region. Panels (c) and (d) show data for the 0.3‐Mbp deletion on chromosome 10. In both chromosomes, DNA quantity is reduced approximately 33% in the affected regions in ‘Novaria’.
