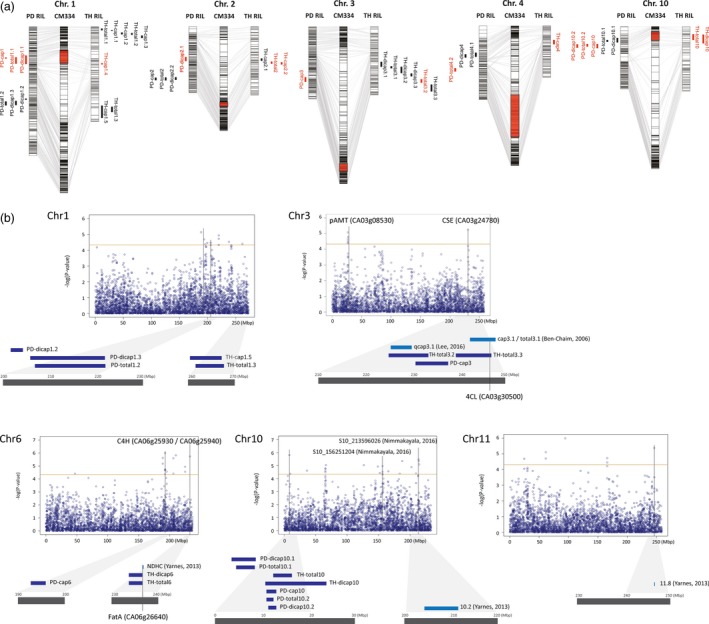
Figure 3.

Comparison of QTLs and SNPs associated with capsaicinoid contents. (a) Common QTLs detected from both ‘PD’ and ‘TH’ RIL populations. The QTLs marked in red are common to both populations. (b) Manhattan plot from GWAS and co‐located QTLs. The threshold of the ‐log(P) was 4.3. QTLs and genes related to capsaicinoid biosynthesis are indicated.
