
Figure 2.
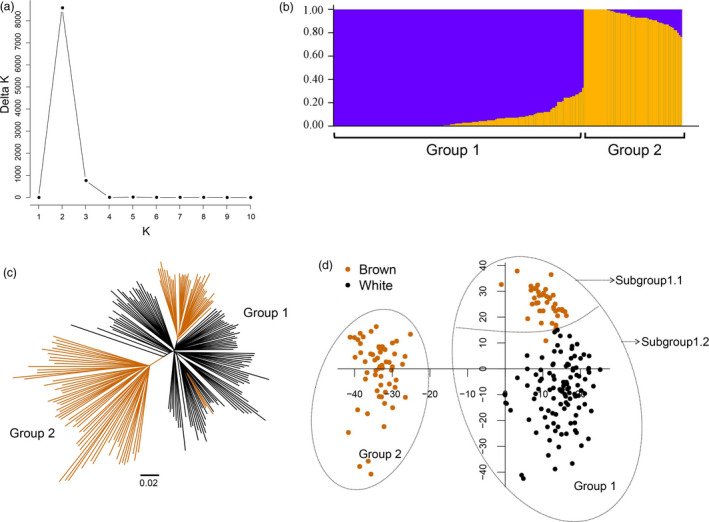
Population structure of the 209‐accession panel. (a) Delta K values plotted from 1 to 10. (b) Population structure of 209‐accession panel (K = 2). (c) Phylogenetic tree based on Nei's genetic distance. (d) Principal component analysis of the 209‐accession panel. Brown indicates the brown fibre accessions, and black indicates white fibre accessions.