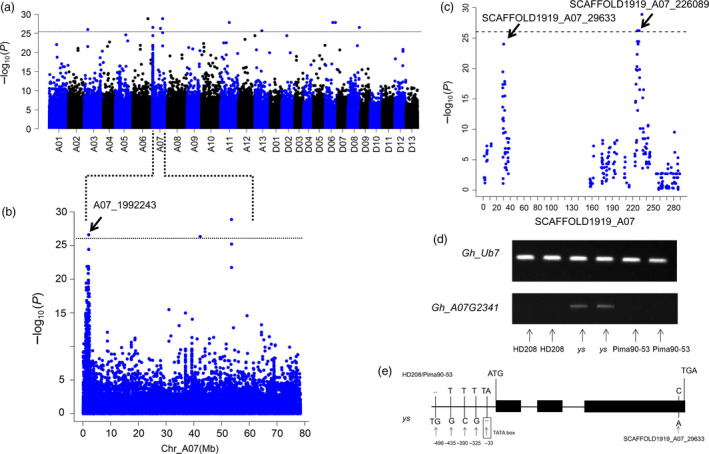
Figure 3.

Case–control association with 209 accessions. (a) Manhattan plot with the case–control association analysis (P < 9.214e−27). (b) Significant association signals on chromosome A07. (c) Plots of the SCAFFOLD1919_A07. The arrows indicate the significantly associated SNPs in (b) and (c). (d) Expression levels of Gh_A07G2341 in HD208, ys and Pima90‐53, with Gh_Ub7 as the control. (e) Polymorphisms of Gh_A07G2341 among HD208, ys and Pima90‐53. The transcription start site (TSS) is set as the ‘0’ location in Gh_A07G2341.
