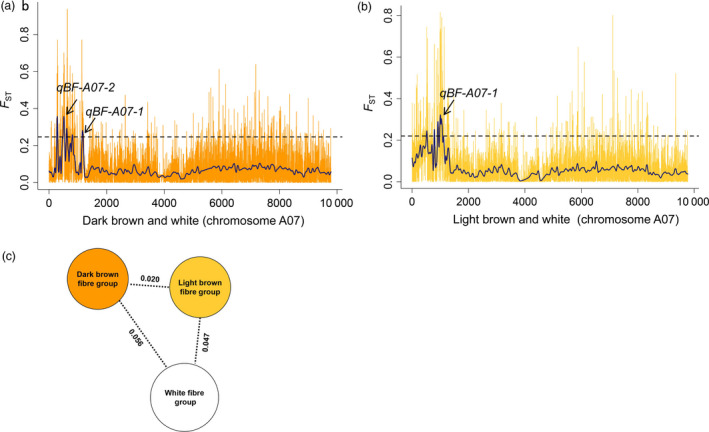
Figure 5.

Population selection signature analysis across the dark brown, light brown and white fibre groups. (a) F ST analysis for chromosome A07 between the dark brown fibre group (n = 30) and the white fibre group (n = 109). The arrows indicate the qBF‐A07‐1 and qBF‐A07‐2 loci. (b) Population selection signature ( F ST ) analysis for chromosome A07 between the light brown fibre group (n = 70) and the white fibre group (n = 109). The arrow indicates the qBF‐A07‐1 locus. (c) F ST divergence across the dark brown, light brown and white fibre groups. The value on each line indicates the population divergence value between groups.
