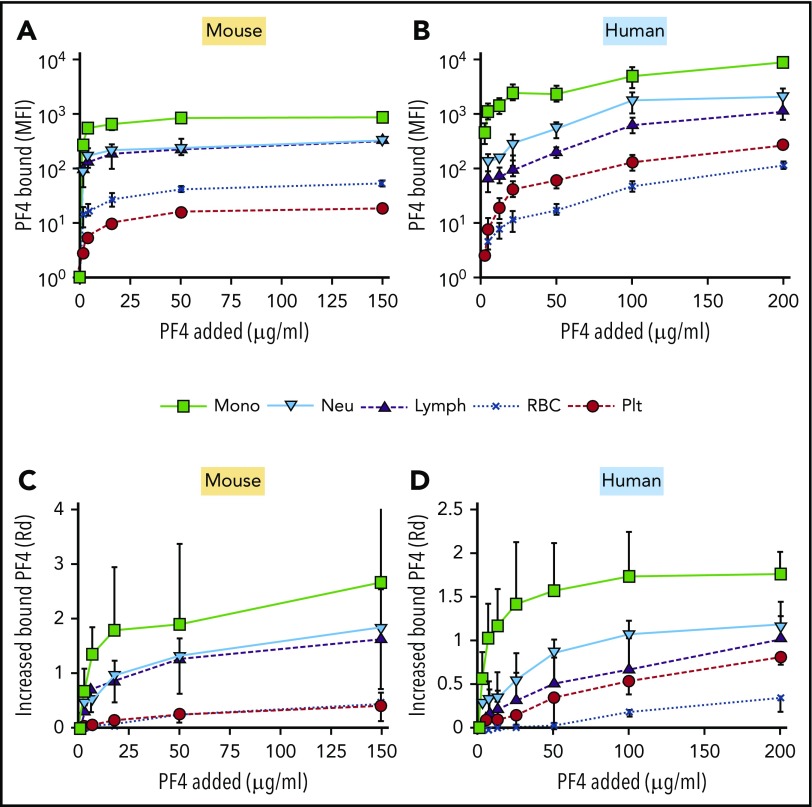
Figure 1.
In vitro distribution of cell-bound PF4 in whole mouse or human blood. (A-D) The ordinate depicts the MFI generated by FITC-PF4 bound to the indicated cell types. (A,C) PF4null murine blood. (B,D) Human blood. (A-B) MFI per cell after background subtraction. (C-D) Similar to panels A and B, but results are expressed as the increase in fluorescence intensity using Rd. Mean ± 1 standard deviation is shown in each. N = 5. Monocytes (mono), green squares; neutrophils (neu), blue triangles; lymphocytes (lymph), inverted purple triangles; RBCs, blue Xs; and platelets (plt), red circles.

