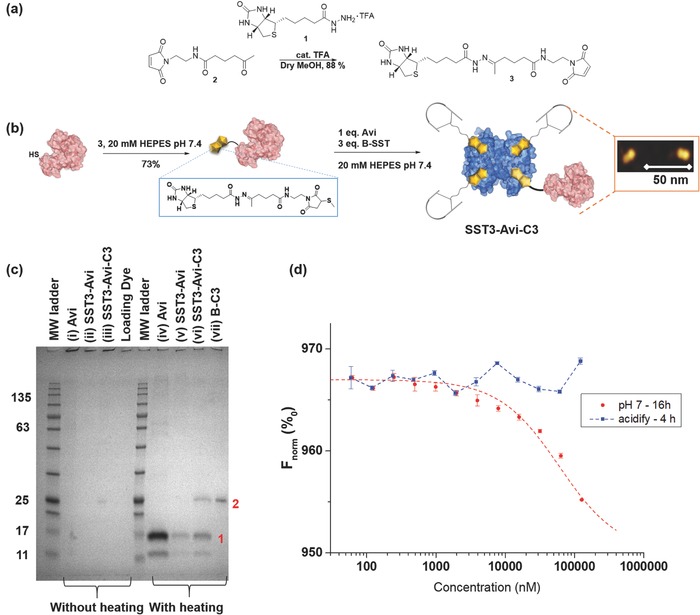
Figure 4.

AFM and SDS‐PAGE analyses show the formation of the multidomain protein SST3‐Avi‐C3; SST3‐Avi‐C3 is cleaved at acidic pH. a) Synthesis of the biotin–maleimide reagent with hydrazone linkage (3). b) Biotinylation of C3 and preparation of the multidomain protein SST3‐Avi‐C3. Orange inset: AFM image showing formation of heterodimers. c) SDS‐PAGE analysis: Avi, SST3‐Avi, SST3‐Avi‐C3 and B‐C3 (25 kDa) without heating and with heating calibrated against a molecular weight marker (Applichem, Protein Marker VI). The proteins were stained and visualized using Imperial protein stain. Bands in lane are assigned as follow: 1) monomeric Avi (≈16 kDa) and 2) B‐C3 (≈25 kDa). d) Binding of B‐C3 to SST3‐Avi determined by microscale thermophoresis (n = 2, values are given as mean ± SD). A binding curve was observed even after 16 h incubation of fluorescent‐labeled B‐C3 and SST3‐Avi, indicating the stability of SST3‐Avi‐C3 (red). After acidification, no binding was observed, which suggests the release of the C3 (blue). The binding curve upon immediate incubation at pH 7 and binding to B‐C3 at pH 4 are available in the Supporting Information.
