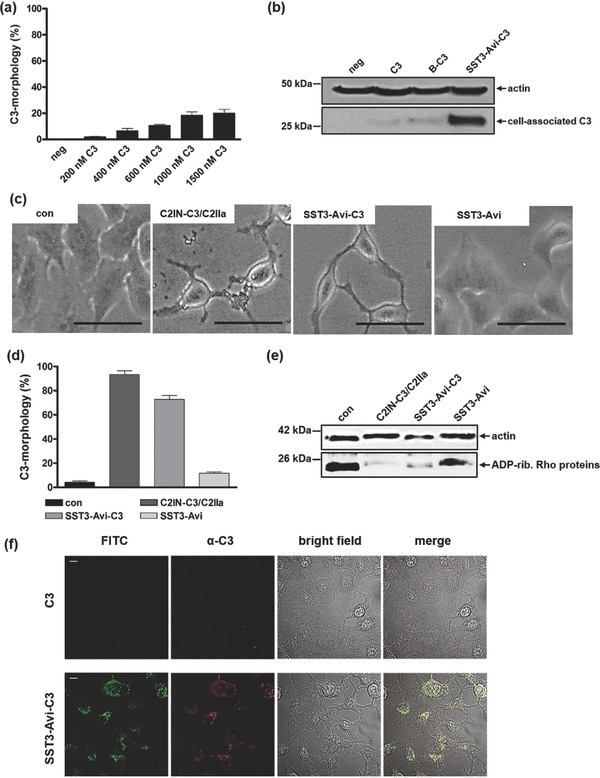
Figure 5.

Treatment of A549 cells with SST3‐Avi‐C3 results in the efficient delivery of C3 accompanied by the characteristic C3‐induced changes in cell morphology due to the C3 catalyzed Rho–ADP‐ribosylation. a) A549 cells were incubated at 37 °C for 24 h with different concentrations of C3 to exclude morphological changes due to C3 alone. b) A549 cells were treated with C3, B‐C3, and SST3‐Avi‐C3 (350 × 10−9 m solutions) or were left untreated. After 24 h, cells were washed, lysed, and cell‐associated C3 was detected using a C3 antibody. Equal protein loading was verified by antiactin immunoblotting. c) A zoom‐in of phase contrast images show the C3‐induced change of the cell morphology when SST3‐Avi‐C3 and the positive control, C2IN‐C3/C2IIa, were applied. Scale bars correspond to 50 µm. d) Cultured A549 cells were treated with C2IN‐C3/C2IIa (100/160 × 10−9 m), SST3‐Avi (400 × 10−9 m), SST3‐Avi‐C3 (350 × 10−9 m), or were left untreated for quantification. For quantitative analysis, the percentage of A549 cells showing C3 morphology was determined from three independent samples treated in the same way (n = 3, values are given as mean ± SD). e) C3 coupled to SST3‐Avi is taken up efficiently into cells and leads to ADP‐ribosylation of Rho proteins in the cytosol of A549 cells. A549 cells were incubated with SST3‐Avi‐C3 (350 × 10−9 m) for 24 h at 37 °C. For control, cells were left untreated or were incubated with either SST3‐Avi (400 × 10−9 m) or C2IN‐C3/C2IIa (100/160 × 10−9 m). Cells were washed, lysed, and lysates were incubated with biotin‐labeled NAD+ (10 × 10−6 m) and fresh C3 (300 ng) for 30 min at 37 °C. Next, lysates were subjected to SDS‐PAGE and Western blot to investigate the amount of biotin‐labeled ADP‐ribosylated Rho, using peroxidase‐coupled streptavidin. Equal protein loading was again verified by antiactin immunoblotting. f) LSM analysis showing internalization of C3 mediated by SST3‐Avi. A549 cells were incubated at 37 °C with SST3‐Avi‐C3 (350 × 10−9 m). After 24 h, cells were washed, fixed, permeated, and stained with a primary rabbit‐antibody against C3 (α‐C3) and visualized using an Alexa 647‐coupled secondary antibody (red). The transporter was labeled with FITC (green). Scale bars correspond to 10 µm.
