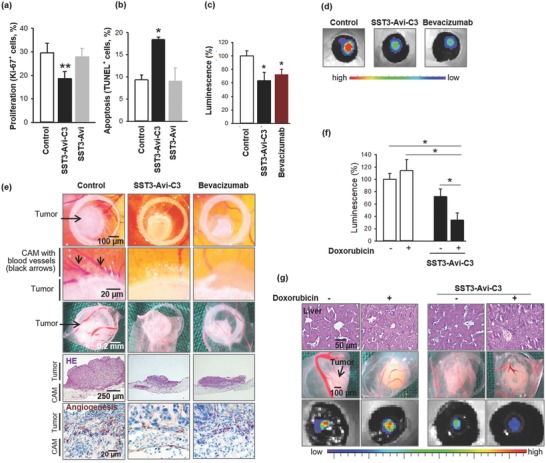
Figure 6.

Selective growth inhibition of A549 lung cancer xenografts, antiangiogenic properties of SST3‐Avi‐C3, and enhanced antitumor efficacy of co‐administration of SST3‐Avi‐C3 with DOX in vivo. a,b) 1 × 10⁶ A549 cells were xenotransplanted on the chorioallantoic membrane of chick eggs 8 d after fertilization. One day later, 20 µL of SST3‐Avi‐C3 (350 × 10−9 m) and of controls (NaCl 0.9%, 400 × 10−9 m SST3‐Avi) were topically applied. After 24 h, tumor xenografts were collected and histopathologically analyzed. For calculation of the proportion of marker positive and negative cells, 200–790 cells per tumor were evaluated. Data are mean ± standard error of the mean (SEM) of 11–13 eggs per group. a) Ki‐67+ proliferating cells in A549 lung cancer xenografts. Newman–Keuls test, **p < 0.01. b) TdT+ apoptotic cells within tumor xenografts. Newman–Keuls test, *p < 0.05. c–e) To further evaluate the antiangiogenic properties of SST3‐Avi‐C3, 1 × 10⁶ tumor cells stably expressing firefly luciferase were xenografted onto the CAM and topically treated with 20 µL of either SST3‐Avi‐C3 (350 × 10−9 m), the antiangiogenic drug bevacizumab (34 × 10−6 m), or control (NaCl 0.9%). Bioluminescence was measured 24 h later, 15 min after topical addition of 10 µL d‐luciferin (0.75 mg mL−1) with an integration time of 1 s. c) Tumor growth was analyzed by expression of luciferase of cancer xenografts measured by an IVIS in vivo imaging system. The values are mean ± SEM of n = 4–6, 100% = 1.57 × 10⁸ photons s−1 cm−2 sr−1. Newman–Keuls test, *p < 0.05. d) Representative IVIS pictures of luciferase expressing tumor xenografts in ovo. e) Representative macroscopic pictures of whole cancer xenografts in ovo (upper row), enlarged at the transition zone between tumor and CAM (second row), tumors after removal (third row), histochemical sections of tumors (fourth row, HE, original magnification 50×) and angiogenesis marker desmin at the transition area of tumor and CAM (bottom row, original magnification 200×). f,g) For co‐administration studies, xenografts grown as described in panel (c) were treated with 20 µL of either SST3‐Avi‐C3 (350 nm) or NaCl 0.9% with or without DOX (100 × 10−6 m). Bioluminescence was measured 24 h later. f) Tumor growth was monitored by luciferase activity of cancer xenografts as measured by an IVIS in vivo imaging system. Data are mean ± SEM of n = 4–12 eggs per group, 100% = 1.35 × 10⁹ photons s−1 cm−2 sr−1. Newman–Keuls test, *p < 0.05. g) Representative sections of chick embryo liver (upper row) and pictures of removed A549 cancer xenografts (center row) and luciferase expressing lung cancer xenografts in ovo (bottom row).
