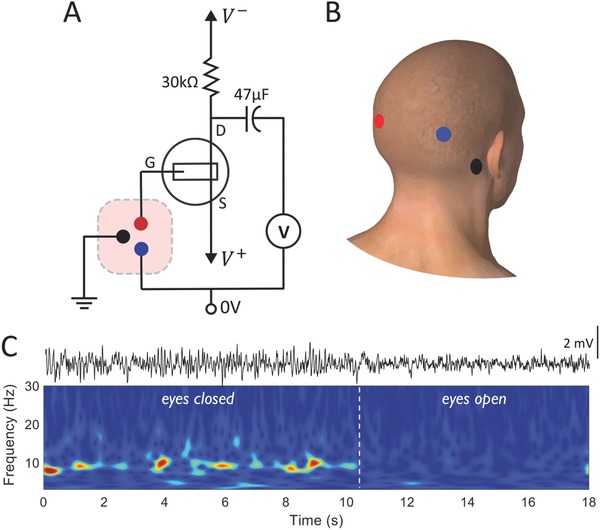
Figure 3.

EEG sensing using a subthreshold OECT voltage amplifier. A) Voltage amplifier circuit wiring diagram for operating the OECT in the subthreshold regime for EEG measurement. B) Electrode placement on the scalp of a human subject color coded corresponding to circuit connections in (A). C) EEG voltage output signal measured in the subthreshold region showing alpha rhythm response (top), and the corresponding time–frequency plot (bottom) showing changes in signal content depending on the eyes being closed and opened. Typical 10 Hz activity, alpha rhythms, are observed in the eyes closed condition.
