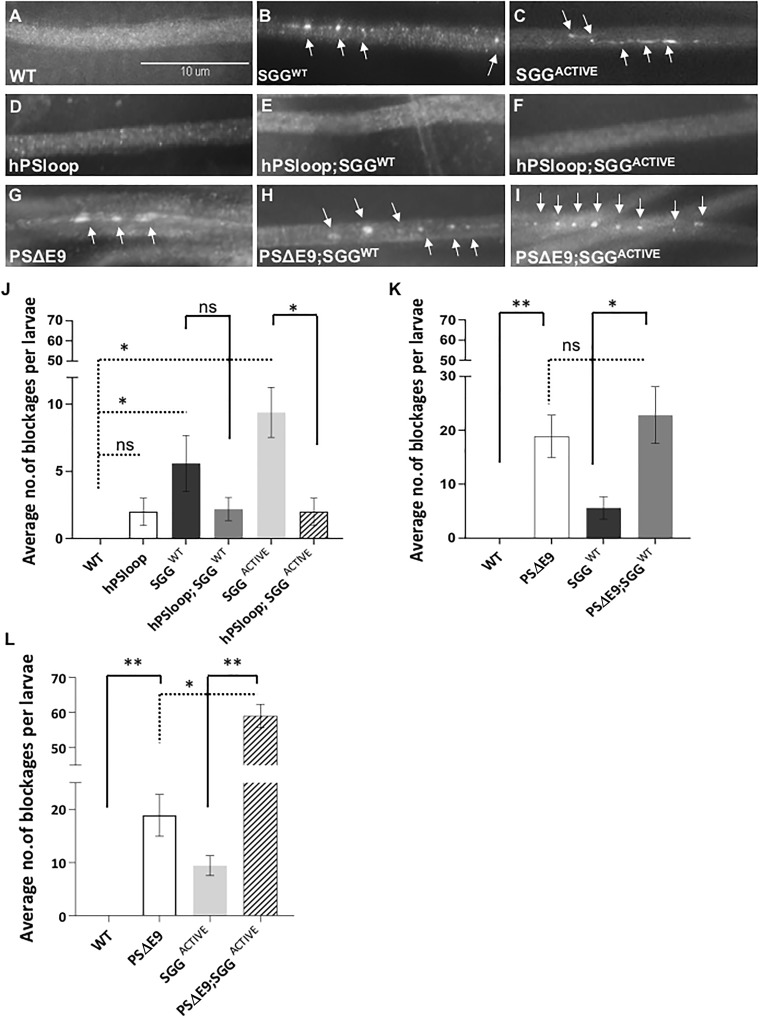
Figure 2.
Expression of PS loop rescues GSK3β mediated transport defects. (A–C) A representative larval segmental nerve from WT larva and larva expressing SGGWT or SGGACTIVE stained with the synaptic vesicle marker CSP. Note that the WT nerve shows smooth staining. In contrast, larval segmental nerves expressing SGGWT or SGGACTIVE show axonal blockages (arrows). Scale Bar = 10 µm. (D) Larval segmental nerves from larvae expressing hPSloop show smooth staining. (E and F) Larval segmental nerves expressing hPSloop and SGGWT or SGGACTIVE also show smooth staining. (G) Larval segmental nerves from larvae expressing PSΔE9 show axonal blockages (arrows). (H and I) Larval segmental nerves from larvae expressing PSΔE9 and SGGWT or SGGACTIVE show axonal blockages (arrows). (J) Quantification analysis shows that the extent of axonal blockages in SGGWT (P = 0.02784), and SGGACTIVE (P = 0.00721) is significant, but the extent of axonal blockages in hPSloop is not (P = 0.09718). Note that while the extent of the decrease of axonal blockages in hPSloop; SGGWT was not significant compared with SGGWT (P = 0.2738), the extent of decrease of axonal blockages was significant in hPSloop; SGGACTIVE (P = 0.0130). N = 5 larvae for each genotype from at least three independent genetic crosses. Data are presented as mean ± SEM. (*P < 0.05, ns = non-significant, using two sided Student’s t-test). (K) Quantification analysis shows that the extent of axonal blockages in larvae expressing PSΔE9 is significant (P = 0.00134) compared with WT. The extent of axonal blockages in larvae expressing PSΔE9 and SGGWT is significant compared with SGGWT alone (P = 0.01847) but is not compared with PSΔE9 alone (P = 0.53979). N = 5 larvae for each genotype from at least three independent genetic crosses. Data are presented as mean ± SEM (*P < 0.05, **P < 0.005, ns = non-significant, using two sided Student’s t-test). (L) Quantification analysis shows that the extent of axonal blockages in larvae expressing PSΔE9 and SGGACTIVE is significantly increased compared with PSΔE9 alone (P = 0.03475) or SGGACTIVE alone (P = 0.000576). N = 5 larvae for each genotype from at least three independent genetic crosses. Data are presented as mean ± SEM (*P < 0.05, **P < 0.005, using Student’s t-test).

