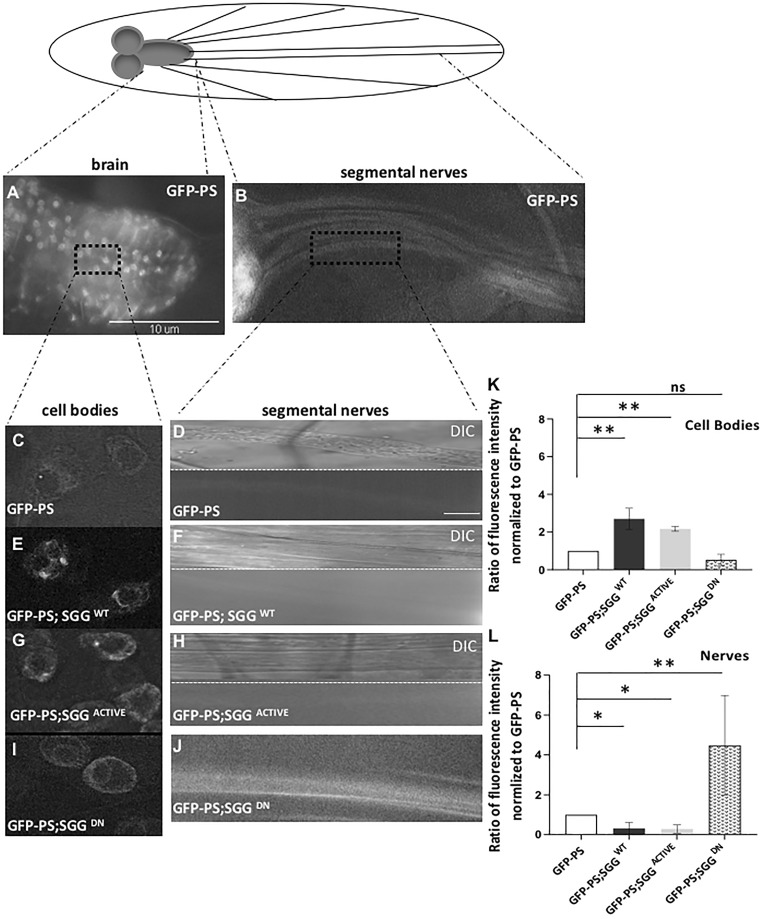
Figure 6.
Expression of GSK3β influences the subcellular localization of PS. (A–D) A schematic diagram of the larval nervous system. GFP-PS is present in the larval brain and in the larval segmental nerves. Enlarged images at 100× show that GFP-PS is present in cell bodies and in the larval nerve. Differential interference contrast (DIC) microscopy images of the larval nerve are also shown. Scale Bar = 10 µm. (E and F) GFP-PS; SGGWT larval brains show increased GFP-PS within the cell bodies and very faint GFP-PS in larval nerves. (G and H) Similarly larval brains expressing GFP-PS; SGGACTIVE show increased GFP-PS within the cell bodies and very faint GFP-PS in larval nerves. (I and J) In contrast, larvae expressing GFP-PS and SGGDN show GFP-PS within cell bodies and within larval nerves. (K and L) Quantification analysis of four cell bodies each from eight larvae (total of 32 cell bodies) show significant increases in the level of GFP-PS in the cell bodies of larvae expressing GFP-PS; SGGWT (P = 0.00497) and GFP-PS; SGGACTIVE (P = 0.00263) compared with larvae expressing GFP-PS alone. However, significant decreases in the level of GFP-PS is seen in the segmental nerves of larvae expressing GFP; SGGWT (P = 0.01545) and GFP-PS: SGGACTIVE (P = 0.005027). N = 8 larval nerves. In contrast, GFP-PS; SGGDN expressing larvae show significant increases in GFP-PS within larval segmental nerves (P = 0.003217) compared with GFP-PS larval nerves. However, the level of GFP-PS in cell bodies of GFP-PS; SGGDN expressing larvae is comparable to GFP-PS alone (P = 0.48172). Data are presented as mean ± SEM. (*P < 0.05, **P < 0.005, Student’s t-test). ns = non-significant.

