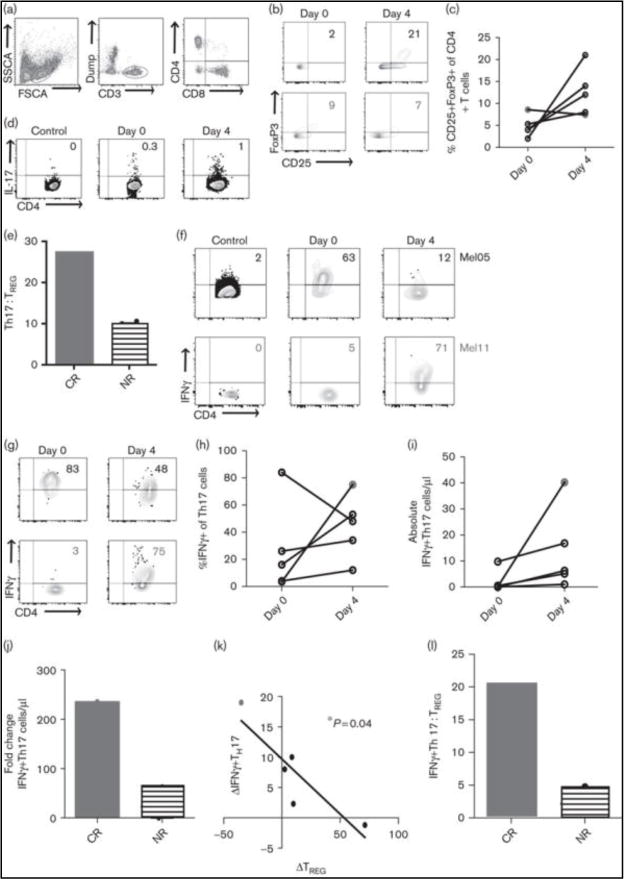
Figure 1. Complete response is associated with a decrease in the frequency of CD25+FoxP3+CD4+ T cells (TREG) and an increase in IFNγ–secreting Th17 cells on day 4 of HDIL-2 therapy.

A. Representative flow plots demonstrate gating strategy for lymphocytes (left), CD3+ T cells (middle), and CD4+ T cells (right). B. Representative flow plots demonstrate changes in TREG frequency in a complete responder (CR, red) and a non-responder (NR, black). C. Summary data for all patients demonstrates change in frequency of TREG cells (ns). D. Representative flow plot demonstrates gating strategy for IL-17+CD4+ (Th17) cells. The control plots (left) represent unstimulated staining and served as the negative control for the patient shown. E. HDIL-2 resulted in a positive Th17:TREG ratio on day 4 of therapy in a complete responder and a negative Th17:TREG ratio in all non-responders. F. (bottom) demonstrate gating strategy for IFNγ-secreting T cells. The control plots (left) represent unstimulated staining and served as the negative control for the patients shown. G. Representative flow plots demonstrate changes in IFNγ expression on Th17 cells. H. Summary data for all patients demonstrates change in the frequency of IFNγ+Th17 cells (ns). I. The complete responder demonstrates a larger increase in the frequency of IFNγ+Th17 cells on day 4 of HDIL-2. J. Change in frequency of TREG cells inversely correlates with frequency of IFNγ+Th17 cells (p = 0.04). K. HDIL-2 resulted in a positive IFNγ+Th17:TREG ratio on day 4 of therapy in a complete responder and a negative IFNγ+Th17:TREG ratio in non-responders.
