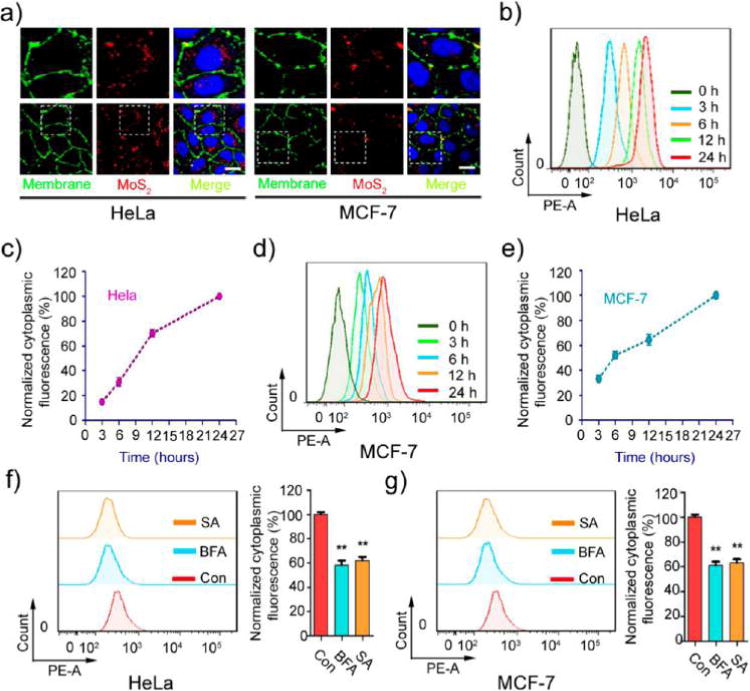
Figure 2.

Effect of energy on MoS2-based NSs’ uptake. (a) The uptake of fluorescent MoS2-based NSs (10 μg/mL) was tested by confocal laser scanning microscopy after 2 h incubation with HeLa and MCF-7 cells. The images in the top row are enlarged versions of the image area in the white box seen in the bottom row. Cell membrane was labeled with molecular probe (red). Scale bars: 10 μm. The uptake of fluorescent MoS2-based NSs was measured by flow cytometer at indicated incubation times in (b) HeLa and (d) MCF-7 cells. Statistical analysis of intracellular fluorescence in (c) HeLa and (e) MCF-7 cells. Cells were pretreated with or without the metabolic inhibitor sodium azide (0.1%) and bafilomycin A (0.05 μM) for 30 min. Then cells were incubated with fluorescent MoS2-based NSs for 2 h. Cytoplasmic fluorescence was measured by flow cytometer in (f) HeLa and (g) MCF-7 cells.
