
Figure 8.
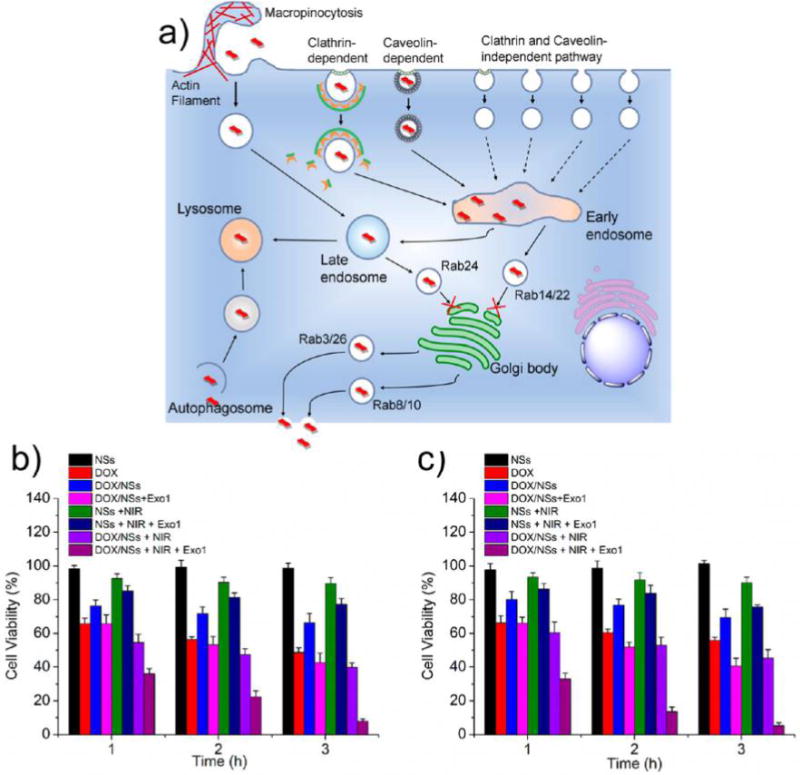
(a) Schematic diagram illustrating the intracellular fates of MoS2-based NSs. The process of trafficking starts with the internalization of NSs through macropinocytosis and both clathrin- and caveolae-dependent endocytosis, and then NSs are transported to early endosomes, shortly after that to late endosomes, and finally to lysosomes; autophagy is involved in the delivery of NSs to lysosomes; exocytosis participates in the secretion of NSs out of the cells; Exo1 inhibits the exocytosis pathways, which leads to the accumulation of MoS2-based NSs in cells. Cell viabilities of (b) HeLa and (c) MCF-7 cells after various treatments indicated: (1) PEGylated MoS2 NSs, (2) DOX, (3) PEGylated MoS2/DOX NSs, (4) PEGylated MoS2/DOX NSs + Exo1, (5) PEGylated MoS2 NSs + NIR, (6) PEGylated MoS2 NSs + NIR + Exo1, (7) PEGylated MoS2/DOX NSs + NIR, and (8) PEGylated MoS2/DOX NSs + NIR + Exo1 for 1, 2, or 3 h ([DOX] = 50 μg/mL, [MoS2] = 50.2 μg/mL, [Exo1] = 50 μg/mL), respectively. NIR: 808 nm laser at a low power density of 0.4 W/cm2 for 5 min after different incubation times. Exo1: pretreated with the cells for 2 h before the different incubation times. Afterward, cells were washed with PBS and incubated for another 24 h in fresh medium before the MTT assay.