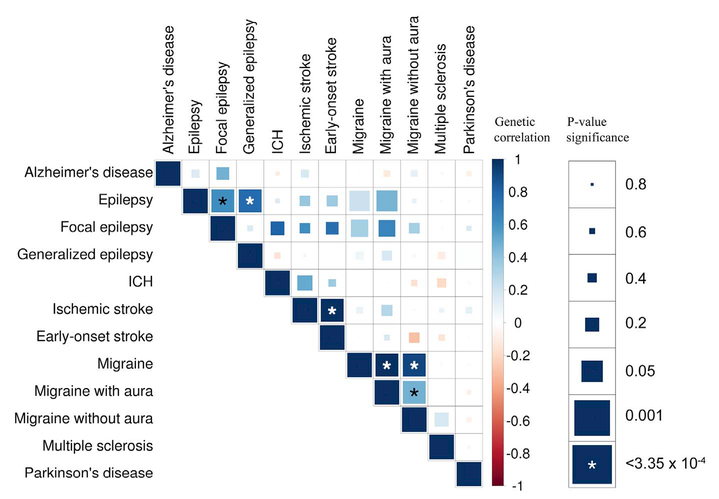
Fig. 2. Genetic correlations across neurological phenotypes.
The color of each box indicates the magnitude of the correlation, and the size of the box indicates its significance (LDSC), with significant correlations filling each square completely. Asterisks indicate genetic correlations that are significantly different from zero after Bonferroni correction. Some phenotypes have substantial overlaps (Table 1)—for instance, all cases of generalized epilepsy are also cases of epilepsy. Asterisks indicate significant genetic correlation after multiple testing correction.

