Figure 1.
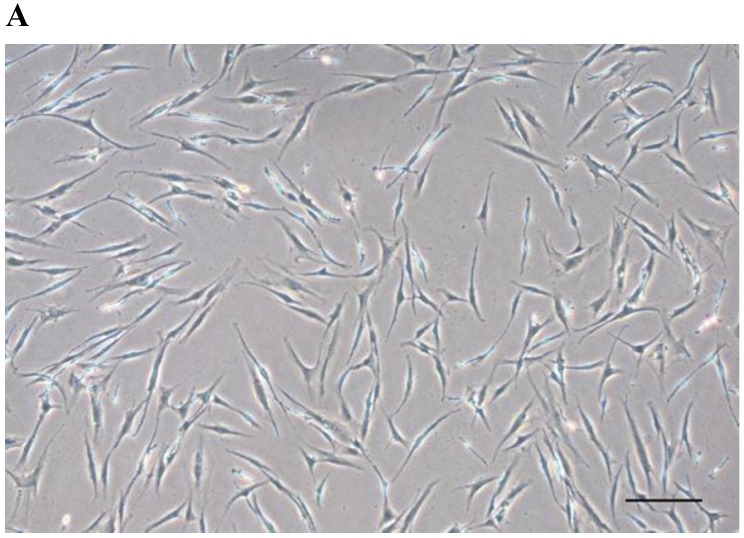
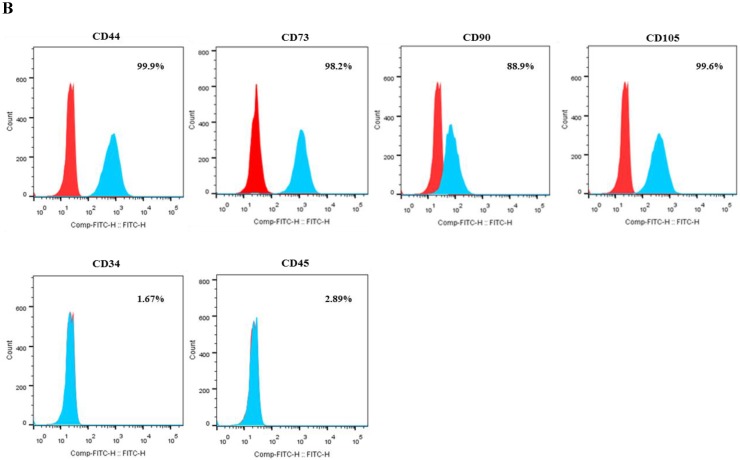
Characterization of DFSCs. A: Differential interference contrast microscope image of DFSCs at passage 3 reveals a spindle-shaped morphology. Scale bar = 250 µm. B: DFSCs are positive for surface markers present on MSCs. C: Differentiation of DFSCs in vitro. Oil red O staining of lipid droplets indicated adipogenesis. Alizarin red S and von Kossa staining of mineralized nodules and calcium deposition indicated osteogenesis. Scale bar = 100 µm.


