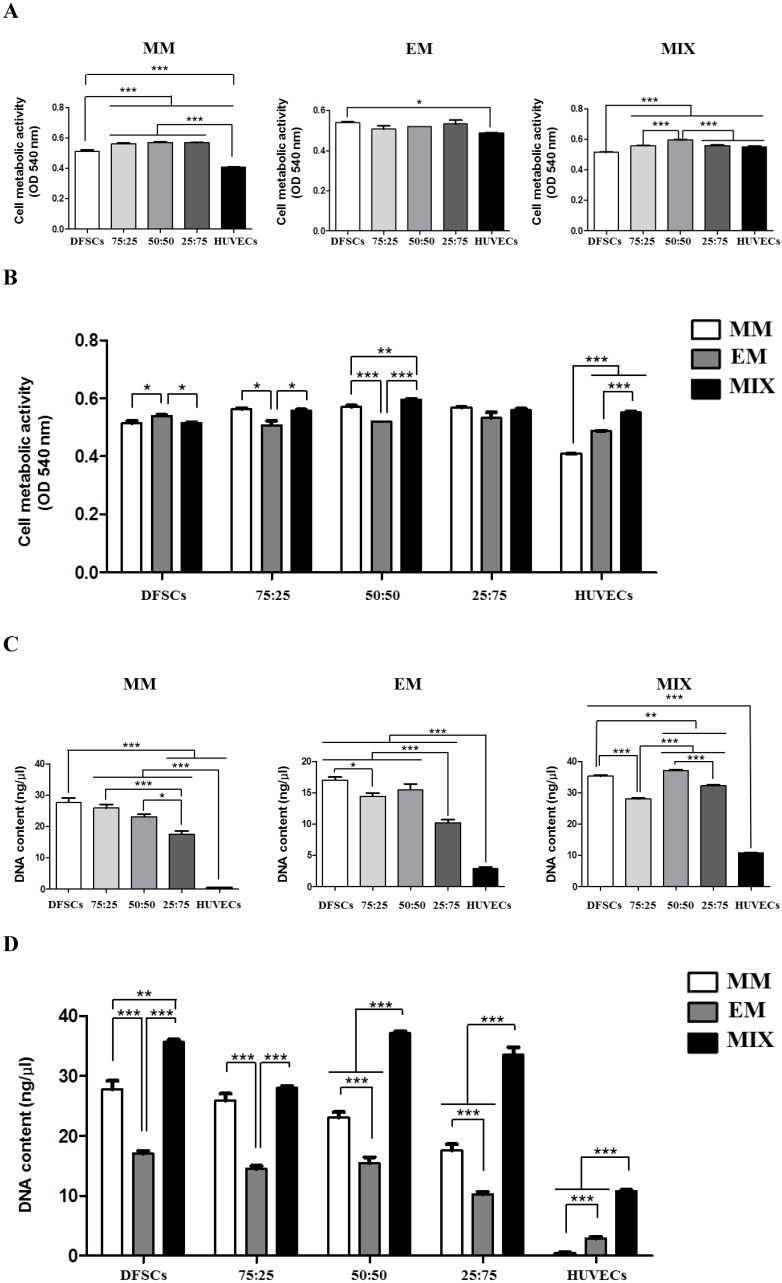
Figure 3.
Cell metabolic activity and DNA content in co-cultures with different cell ratios (DFSC/HUVEC ratios of 100:0, 75:25, 50:50, 25:75, or 0:100) grown in different culture media (MM, EM, and MIX). A and B: Cell metabolic activity. C and D: DNA content. * indicates P < 0.05, ** indicates P < 0.01, and *** indicates P < 0.001. MM: MSCs growth medium; EM: endothelial cell growth medium; MIX: 1:1 mixture of MM and EM.

