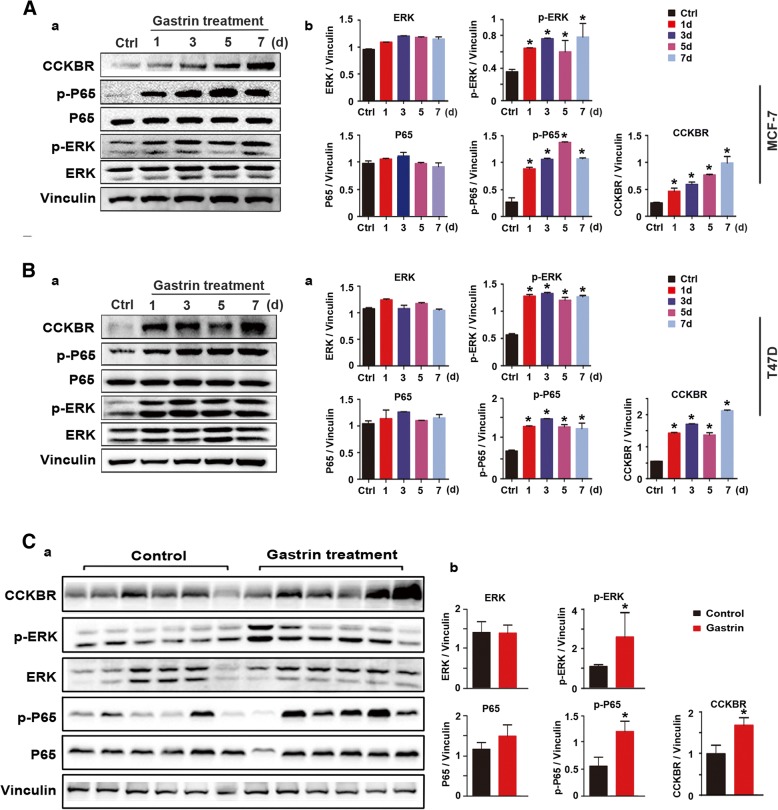
Fig. 4.
Gastrin inhibited growth of ER+ BC through upregulation of CCKBR/p-ERK/p-P65. (a-b) Left panels, expression of CCKBR, ERK/P65, and p-ERK/p-P65 in ER+ MCF-7 and T-47D cells (from Fig. 3A, a and b) detected by Western blot. Right panels, gray density analysis of bands in left panels. c Expression of CCKBR, ERK/P65, and p-ERK/p-P65 in tumors shown in Fig. 3C detected by Western blot. Bands in the upper panel were quantified by gray density analysis and shown in the lower panel. d Expression of CCKBR, ERK/P65, and p-ERK/p-P65 in tumors shown in Fig. 1C detected by Western blot. Bands in left panel were quantified by gray density analysis and shown in the lower panel

