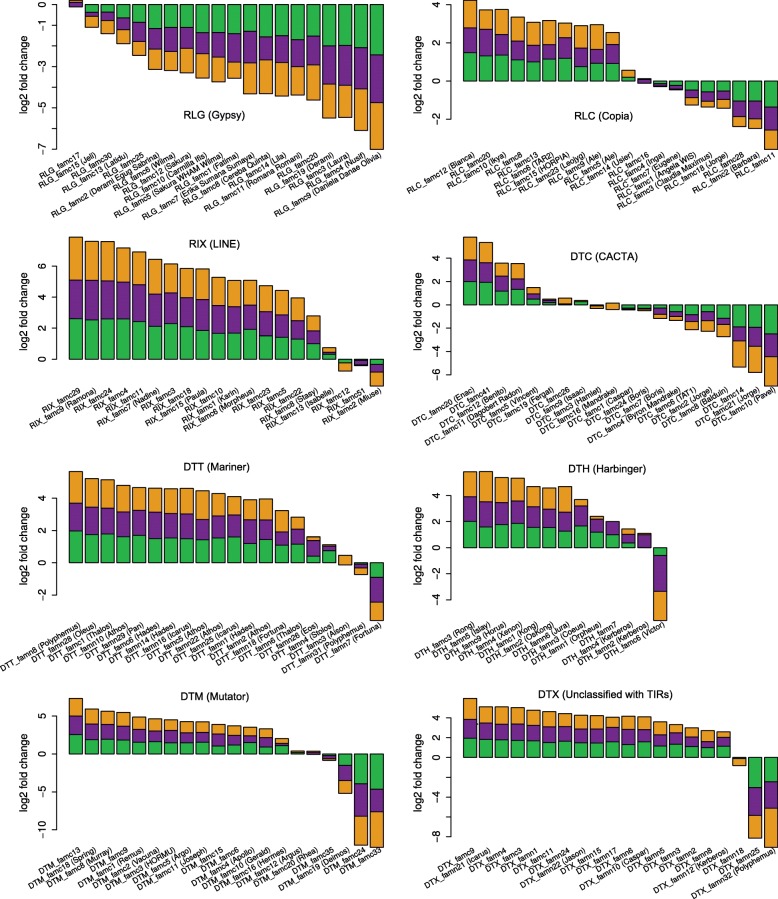
Fig. 8.
Enrichment analyses of TE families within gene promoters. The y-axis represents the log2 ratio of the proportion (i.e., percentage in terms of number of copies) of each TE family observed in the promoter of genes (2 kb upstream the TSS) relative to their proportion at the whole subgenome level. Positive and negative values represent an over- and under-representation of a given family in the promoters, respectively. Log2 ratios were calculated for the three subgenomes independently (A green; B violet; D orange) and the three values were represented here as a stacked histogram. Only highly repeated families (500 copies or more) are represented, with 1 panel per superfamily. Families are ordered decreasingly along the x-axis according to the whole genome log2 ratio

