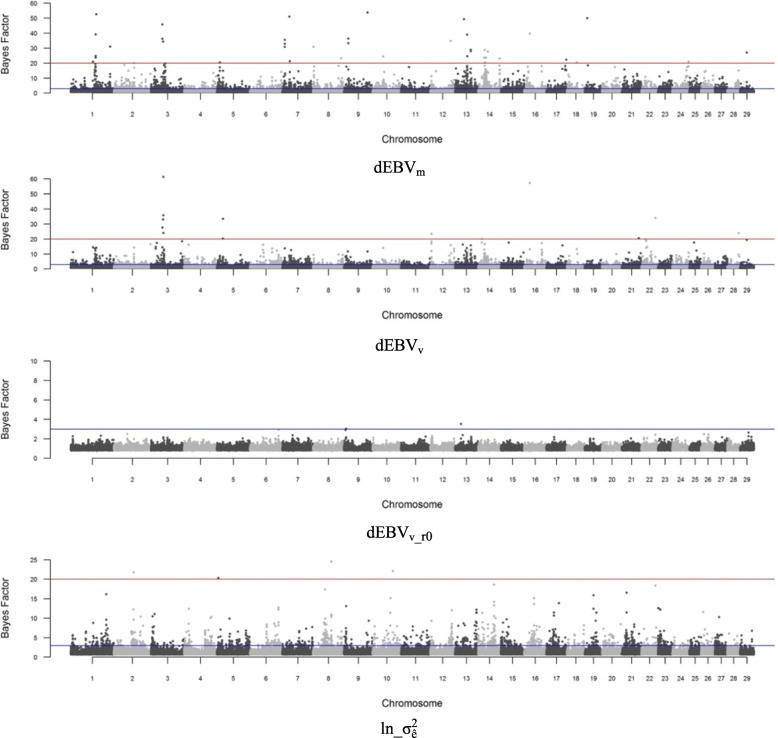
Fig. 1.
Manhattan plot for the mean (dEBVm) and residual variance (dEBVv, dEBVv_r0, ln_) of yearling weight. dEBVm and dEBVv: deregressed EBV for mean and residual variance, respectively; dEBVv_r0 and ln_: deregressed EBV for residual variance and log-transformed variance of estimated residuals, respectively, both obtained from solutions of a DHGLM assuming null genetic correlation between mean and residual variance. The horizontal blue and red lines represent Bayes Factor of 3 (suggestive) and 20 (strong), respectively

