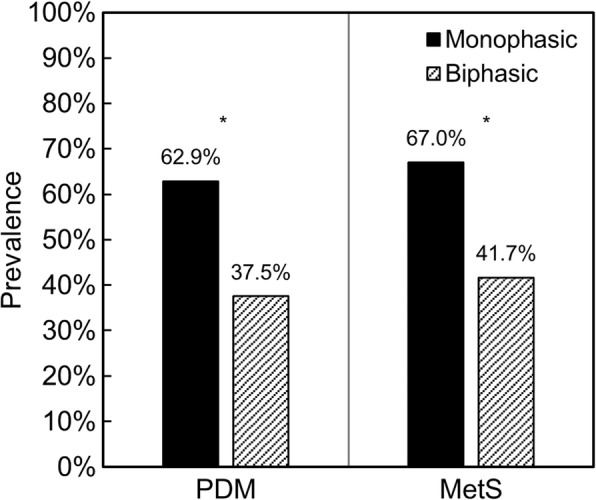
Fig. 2.

Prevalence of prediabetes and metabolic syndrome according to the shape of the glucose curve. * PDM: p = 0.024 (no adjustment), p = 0.120 (adjusted for waist circumference), p = 0.059 (adjusted for glucose AUC); MetS: p = 0.022 (no adjustment), p = 0.061 (adjusted for waist circumference), p = 0.772 (adjusted for glucose AUC)
