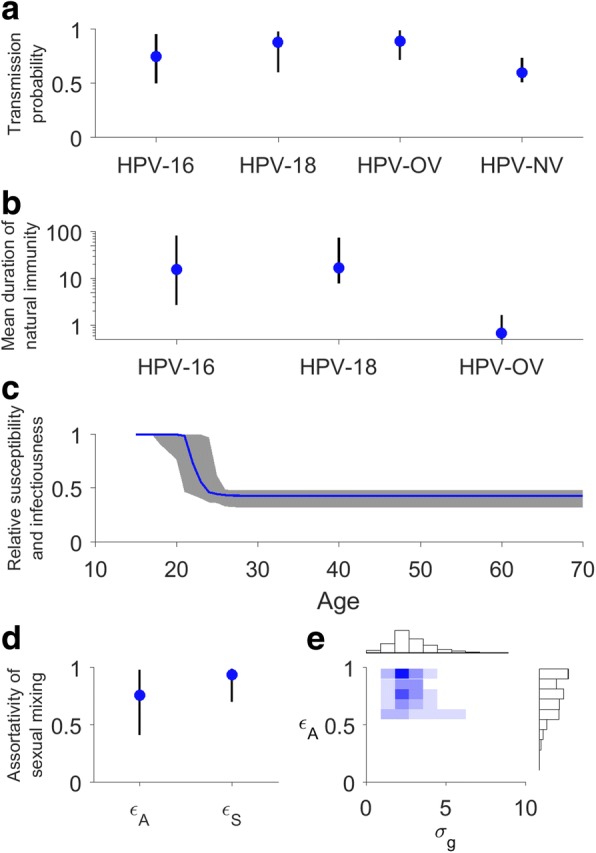
Fig. 2.

Key parameter estimates in the fitted model. Circles and vertical lines indicate posterior medians and 95% credible intervals. a Baseline probability of HPV transmission per sexual partnership. b Mean duration of natural immunity (on log-scale). c Age-specific susceptibility and infectiousness. The line and shades indicate medians and 95% credible intervals. d εA and εS for assortativity of sexual mixing. e Joint posterior distribution of εA and σg. Higher values of εA and smaller values of σg mean higher degree of age assortativity. Darker color indicates higher density. See Additional file 1: Table S2 for all inferred parameter values
