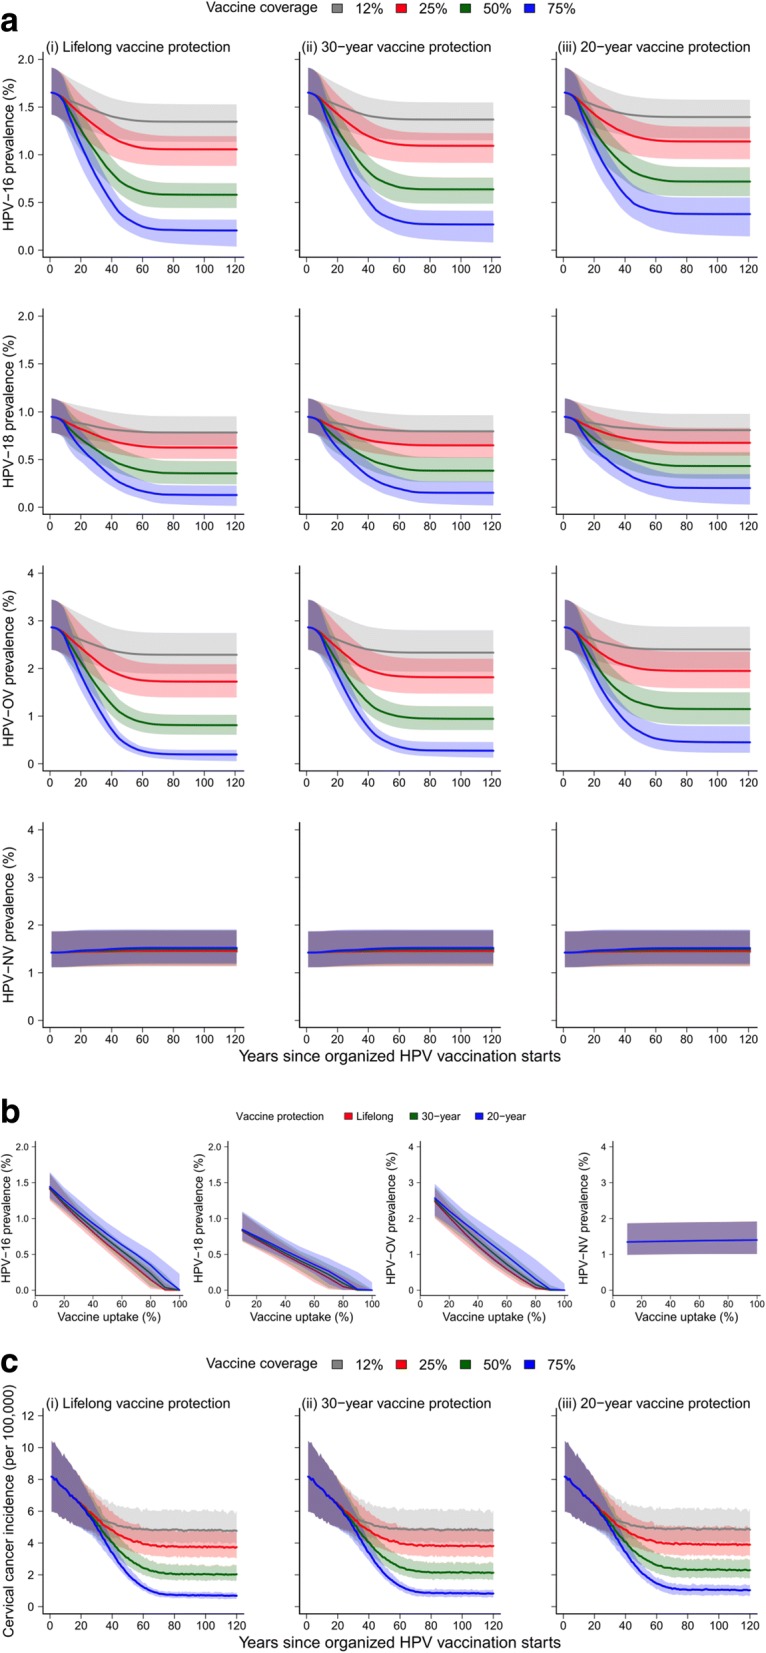
Fig. 3.

Epidemiologic impact of routine female adolescent HPV vaccination. The curves and shades indicate the medians and 95% central ranges of the outcomes across all 100 probabilistic sensitivity analysis scenarios on natural history parameters, respectively. a Age-standardized HPV prevalence over time. b Age-standardized HPV prevalence after 100 years of routine vaccination as a function of vaccine uptake. c Age-standardized incidence of cervical cancer over time
