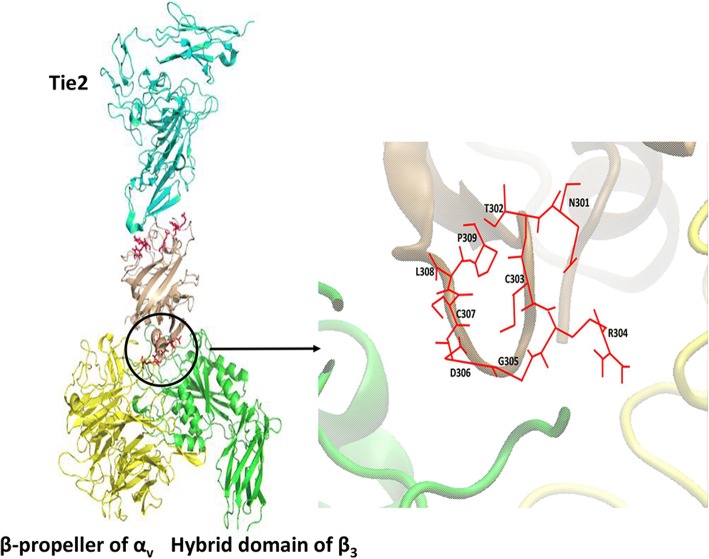
Fig. 3.
Structure of the Tie2–Ang2-BDBC5–αvβ3 complex. The Tie2 structure was aligned into the last frame of the Ang2-BDBC5–integrin αvβ3 MD simulation. Tie2 is shown in cyan, Ang2-BDBC5 in beige, αv in yellow, and β3 in green. Tie2-binding residues of Ang2 are colored magenta and NTCRGDCLP mutant residues in red. A zoom-in of the binding interface between Ang2-BDBC5 and αvβ3 integrin is also shown. On the right, an all-atom representation of the mutant residues of Ang2-BDBC5 is shown in stick form

