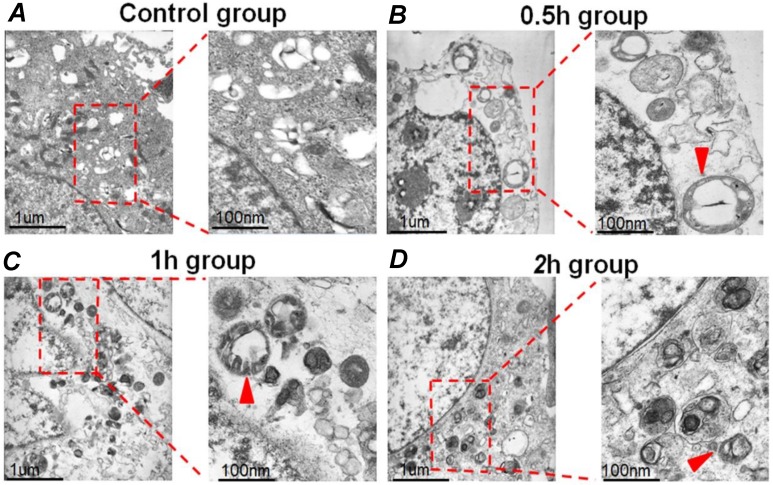
Figure 1.
The typical TEM images of autophagosomes in HepG2 cells. (A) The HepG2 cells were cultured under static culture conditions (control group). The cells were exposed to 1.4 dyn/cm2 FSS for 0.5h, 1h and 2h, which defined as 0.5h (B), 1h (C), and 2h group (D). Scale bar=1 μm. The enlarged images showed the autophagosomes with bilayer membrane structure (indicated by red arrows). Scar bars in figures are 100 nm.

