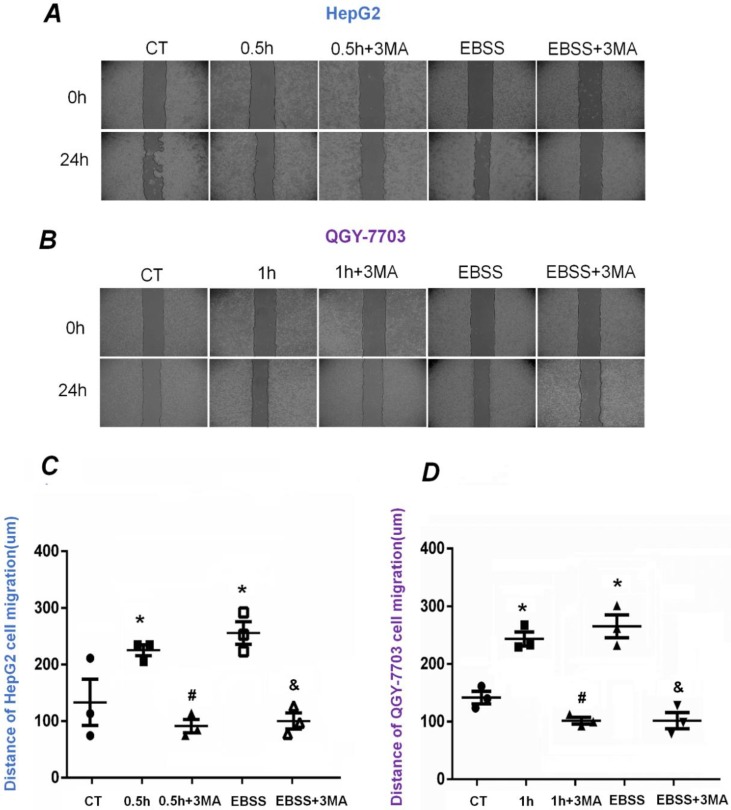
Figure 5.
The effects of FSS-induced autophagy on HepG2 and QGY-7703 cell migration. Typical images of HepG2 cells (A) and QGY-7703 cells (B) migration at 0h and 24 h, respectively. Statistically analyzed the migration distance of HepG2 cells (C) and QGY-7703 cells (D). Both cells migration ability remarkably enhanced in FSS group and EBSS group, then decreased with the pre-treatment of 3MA inhibitor. *, P<0.05 vs CT; #, P<0.05 vs 0.5h (HepG2 cells) or 1h group (QGY-7703 cells); &, P<0.05 vs EBSS group.

